RHADS End-to-End: Production-Ready Development Lifecycle
|
Quick Logout Links Prior to starting this module, click the following two links and make sure you log out of previous sessions to prevent errors related to performing actions as the wrong user. |
Hands-on Lab
This hands-on lab will walk you through the use of RHADS from the perspective of a developer. We will examine and explain each step in terms of what is technically happening with the product, and then we will walk through altering an example TSSC pipeline (as stated before some customers may/will want to add additional security steps as part of their processes).
Walk-through of end-to-end interaction
For this part of the lab we will be using a lot of the tooling and interfaces provided by the product. You will visit a number of different URLs to complete the lab. Here’s a list of them you can use when needed:
-
The {rhdh_url}[Red Hat Developer Hub URL^]
-
Username:
{rhdh_user} -
Password:
{rhdh_user_password}
-
-
The {gitlab_url}[GitLab URL^]
-
Username:
{gitlab_user} -
Password:
{gitlab_user_password}
-
-
The {openshift_console_url}[OpenShift Web Console URL^] (we will use the administrator login to examine some of the behaviours on the cluster resulting from the template and ArgoCD)
-
Admin Username:
{openshift_admin_user} -
Password:
{openshift_admin_password}
-
The point of this part of the hands-on lab is to give you a feel of what the end user experience is whilst making you aware of the technical components that are being used so that you can describe them to end customers.
Login and explore the Catalog
-
Start by logging into the {rhdh_url}[Red Hat Developer Hub^]. The screen will look like this:
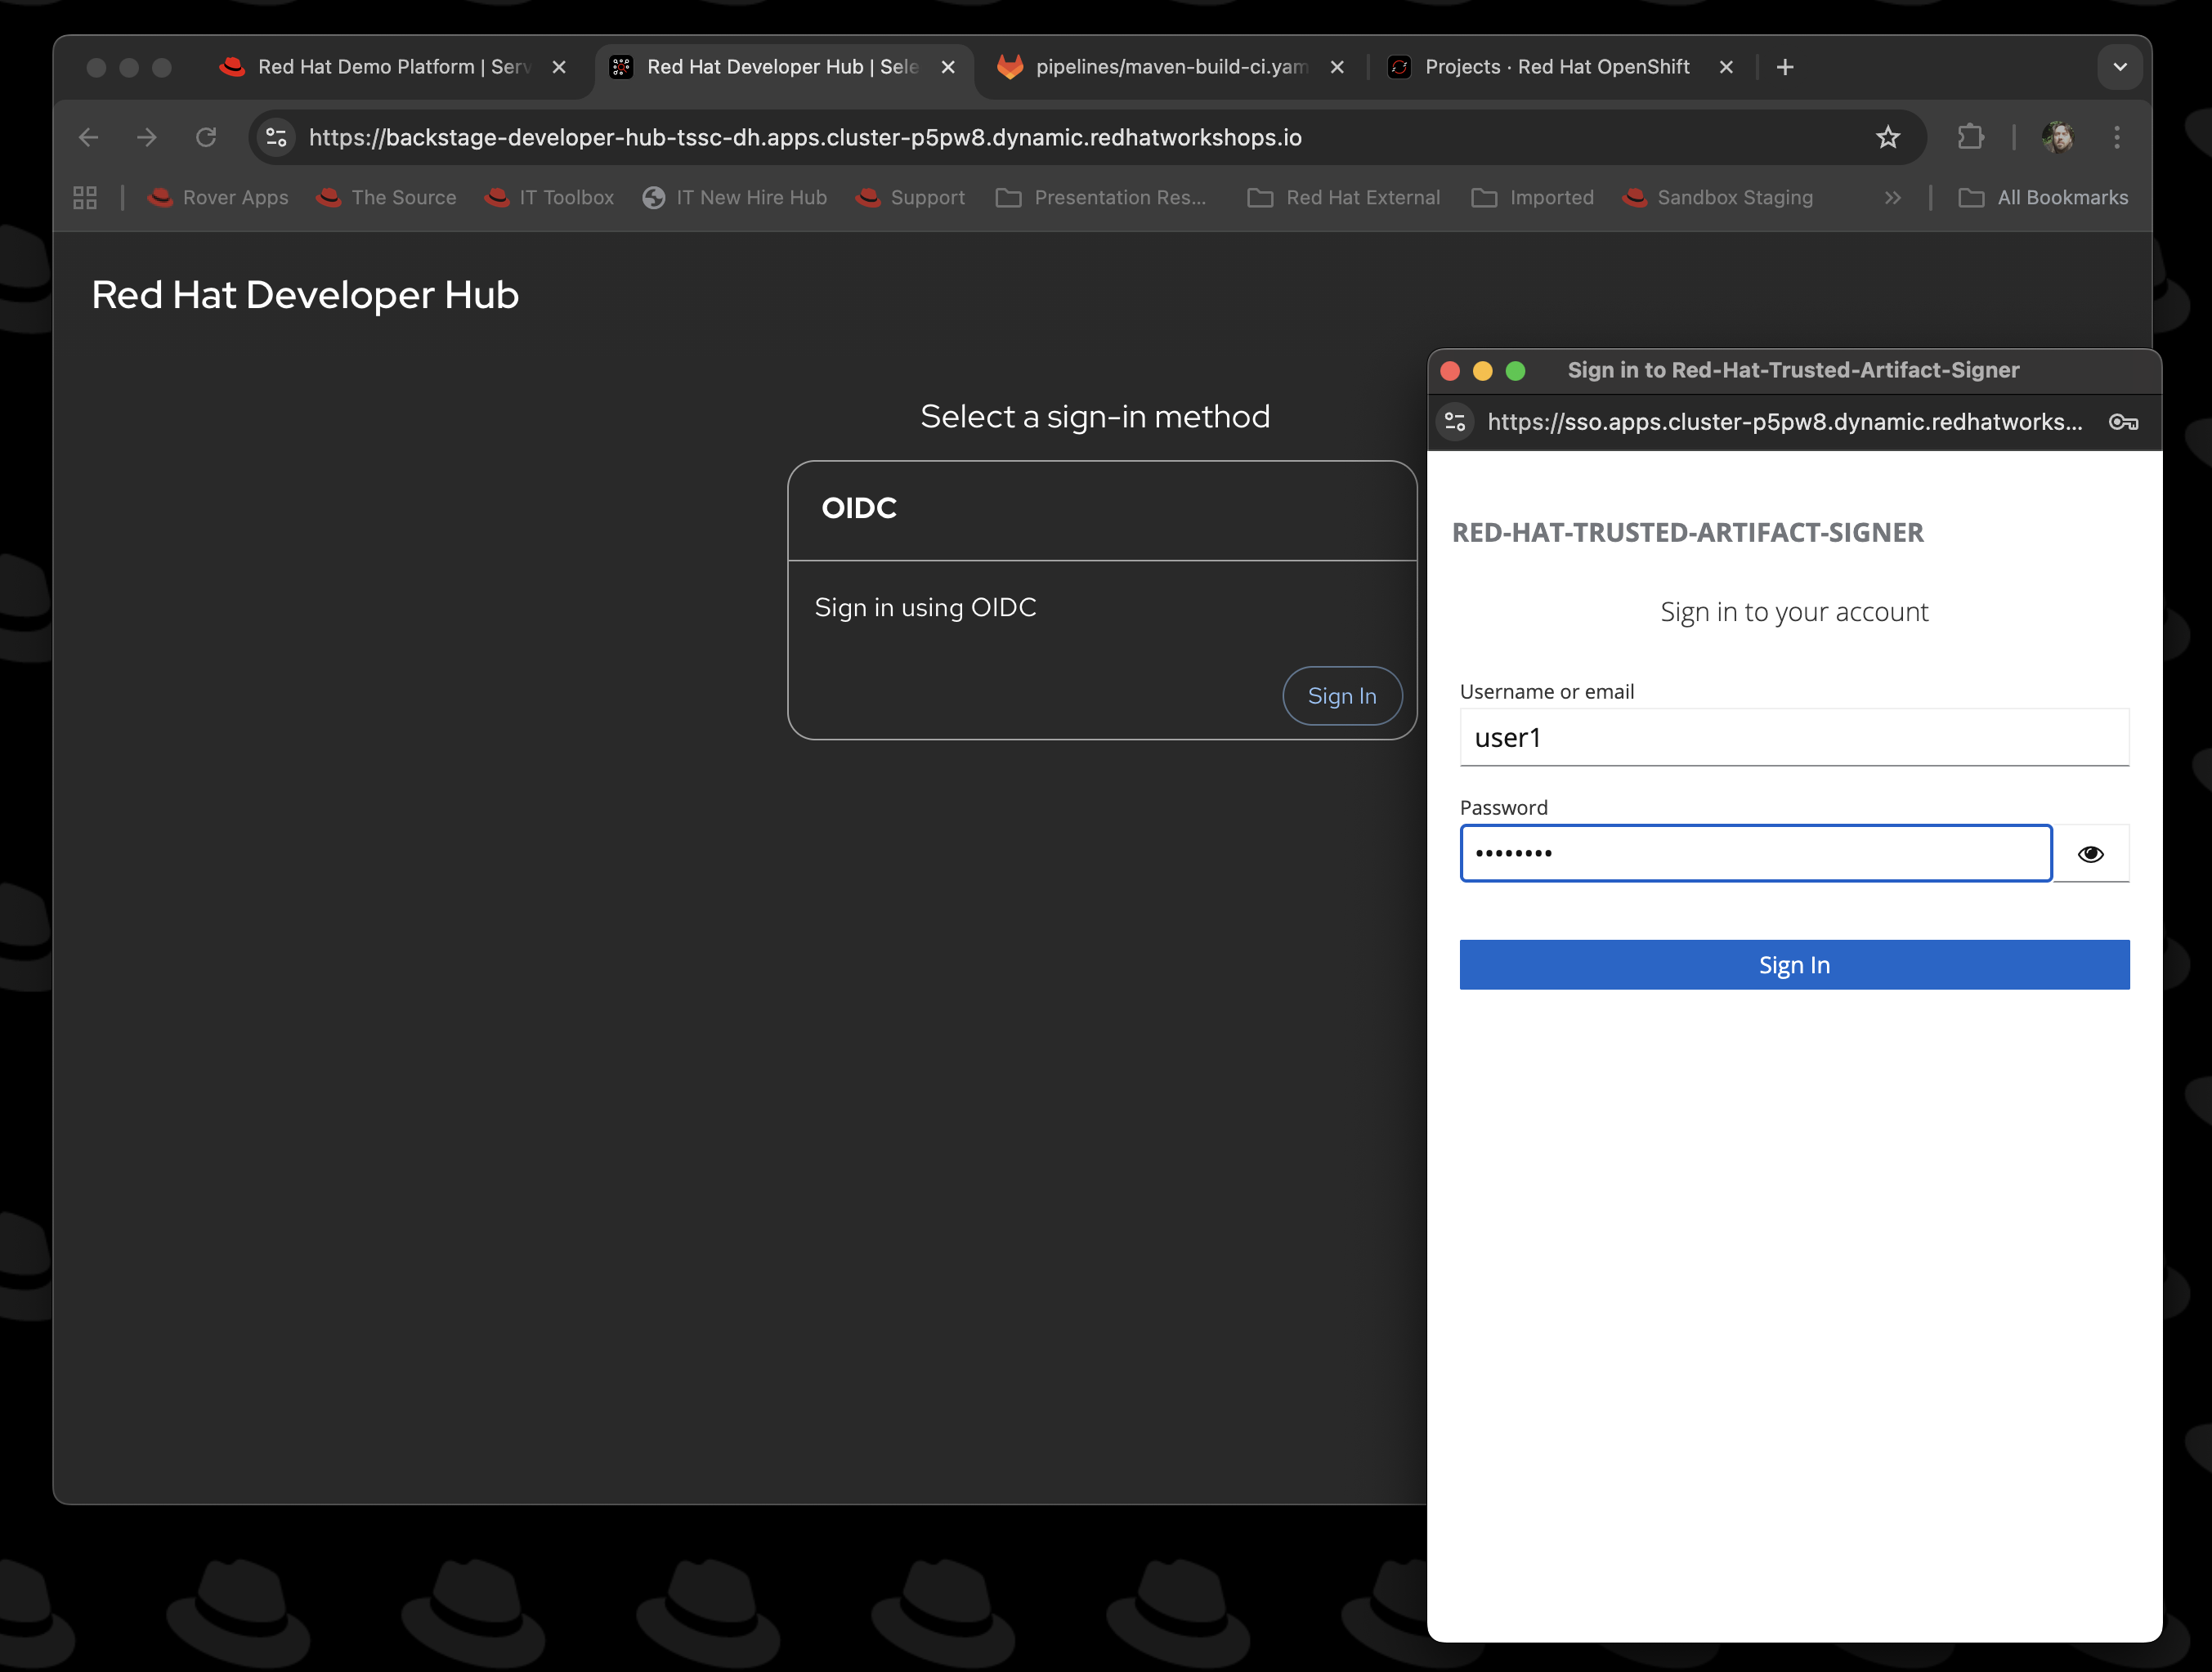
The username will be
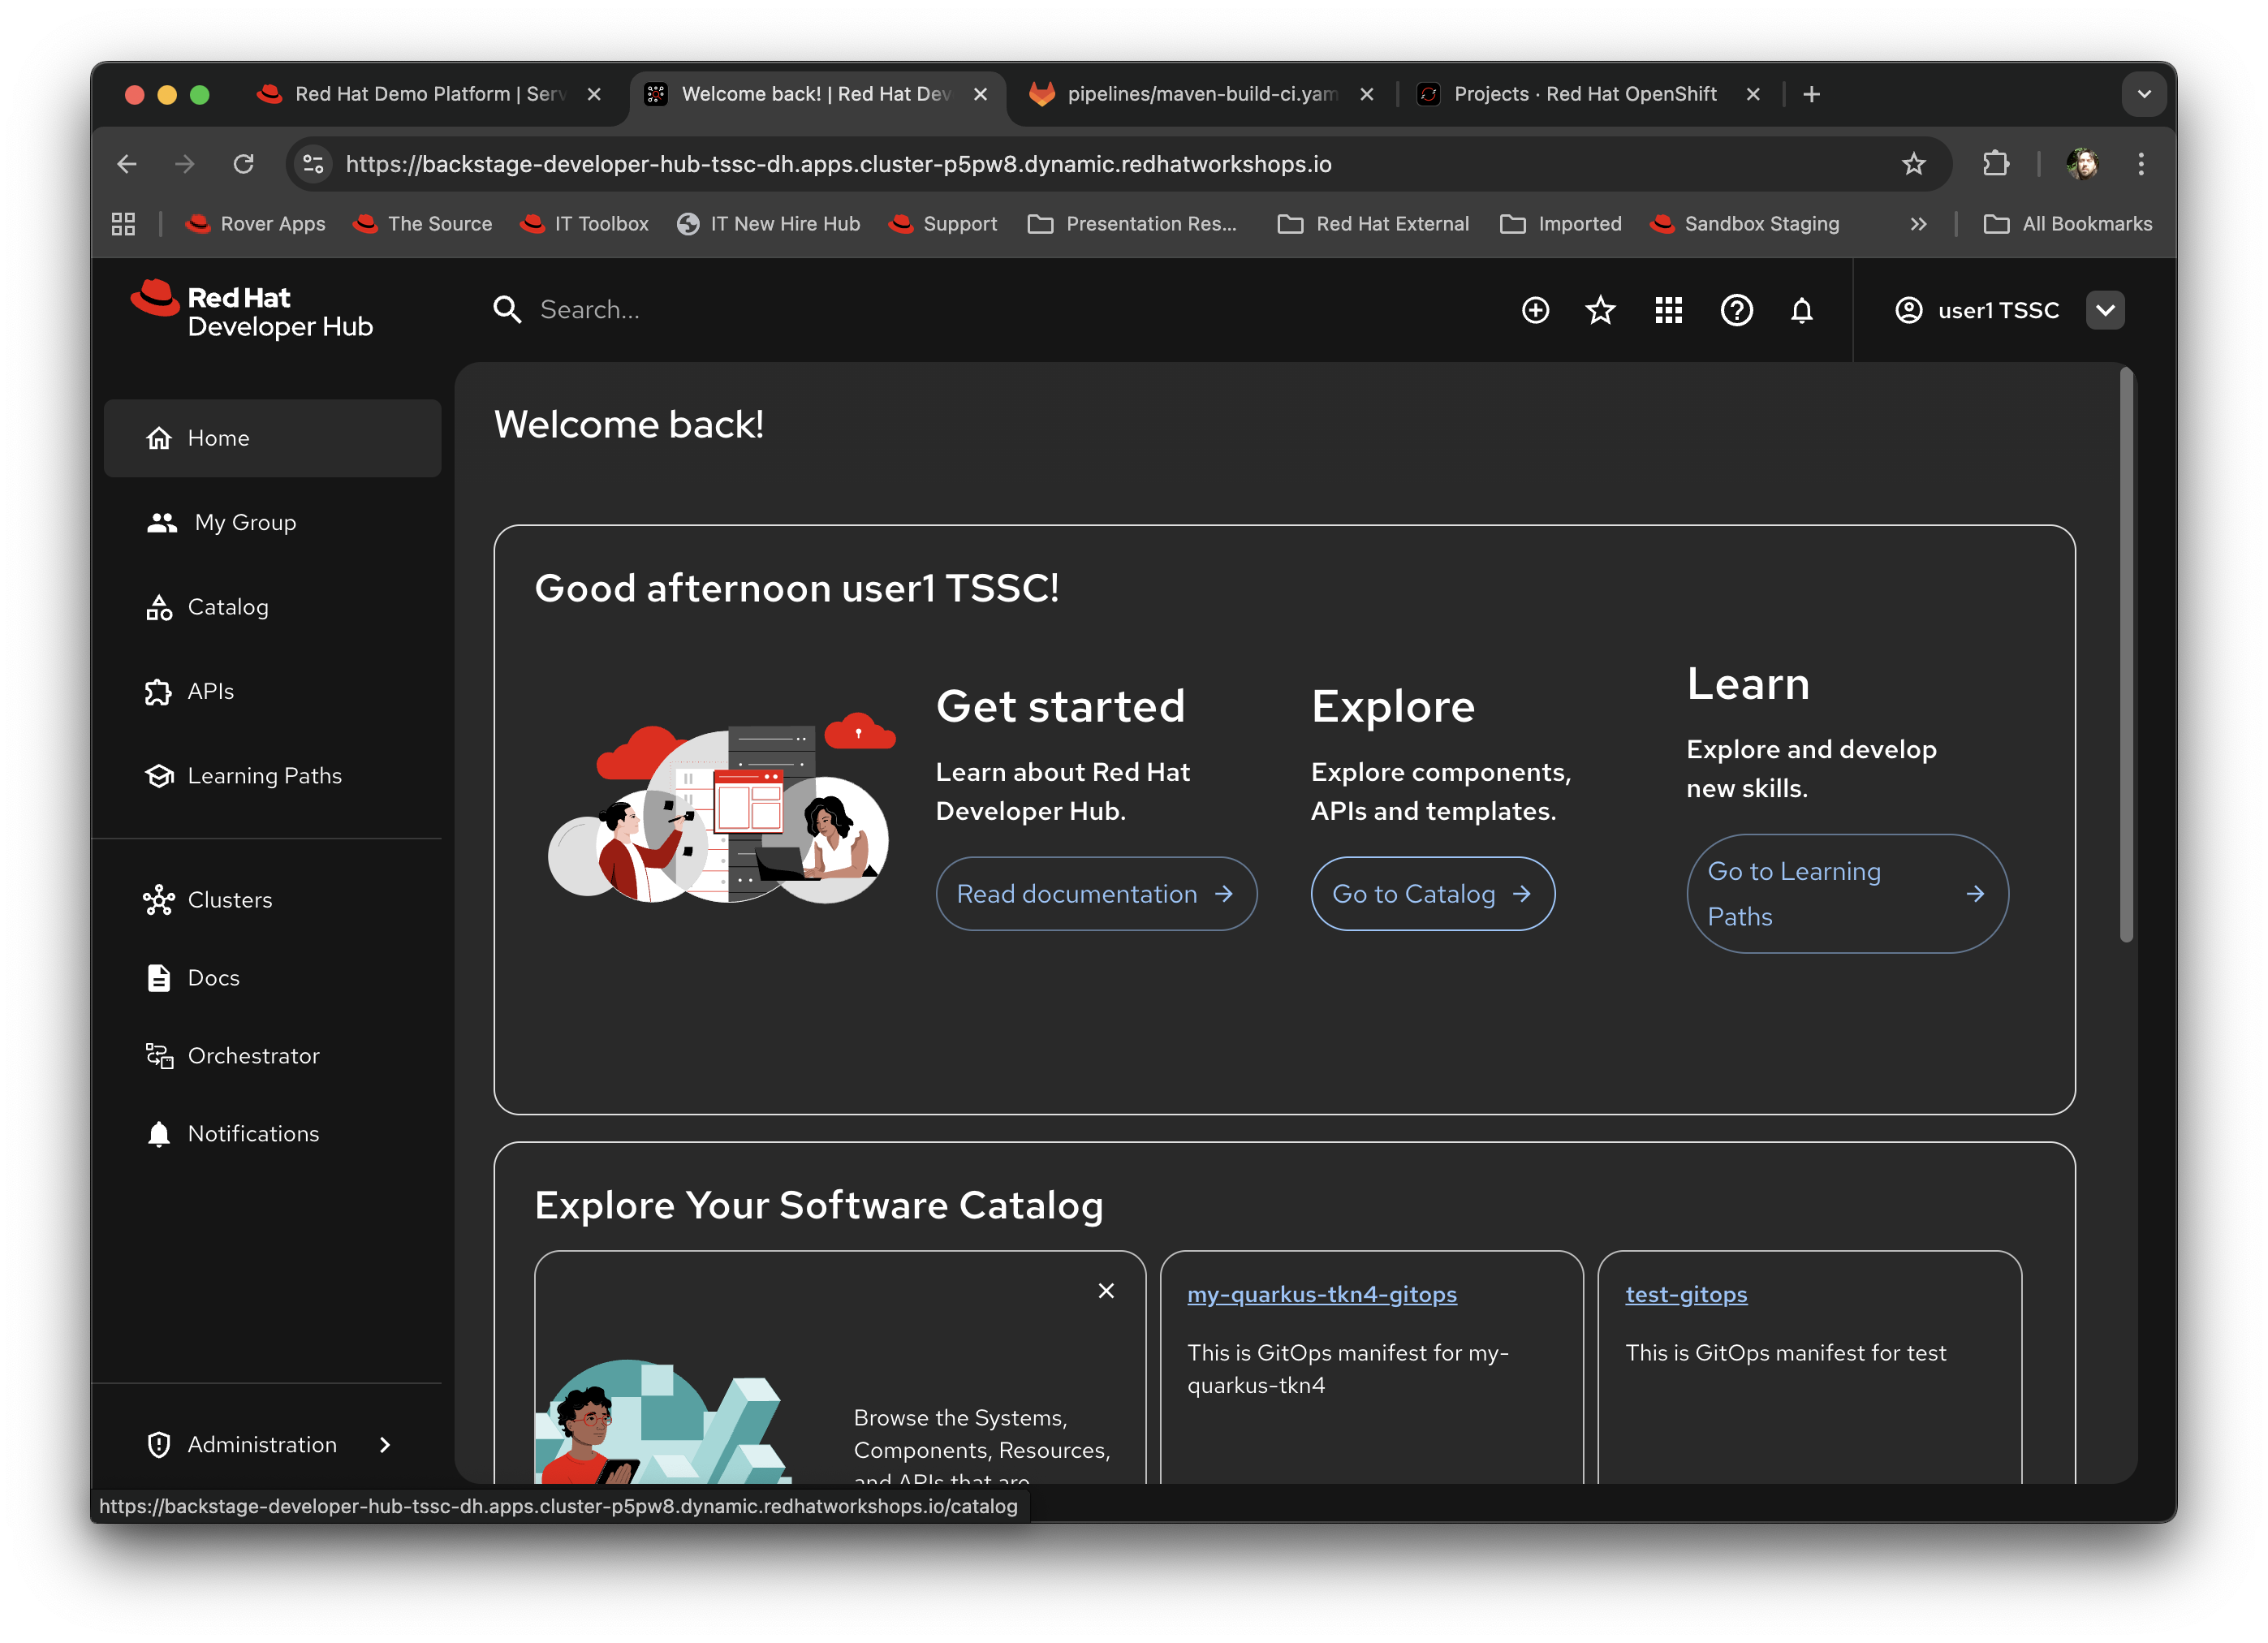
{rhdh_user}; we are logging on to the system with a standard user rather than admin.The Red Hat Developer Hub screen will render; if it is the first time, you will get a helpful information panel on the right hand side; close this to give yourself more screen real estate.
-
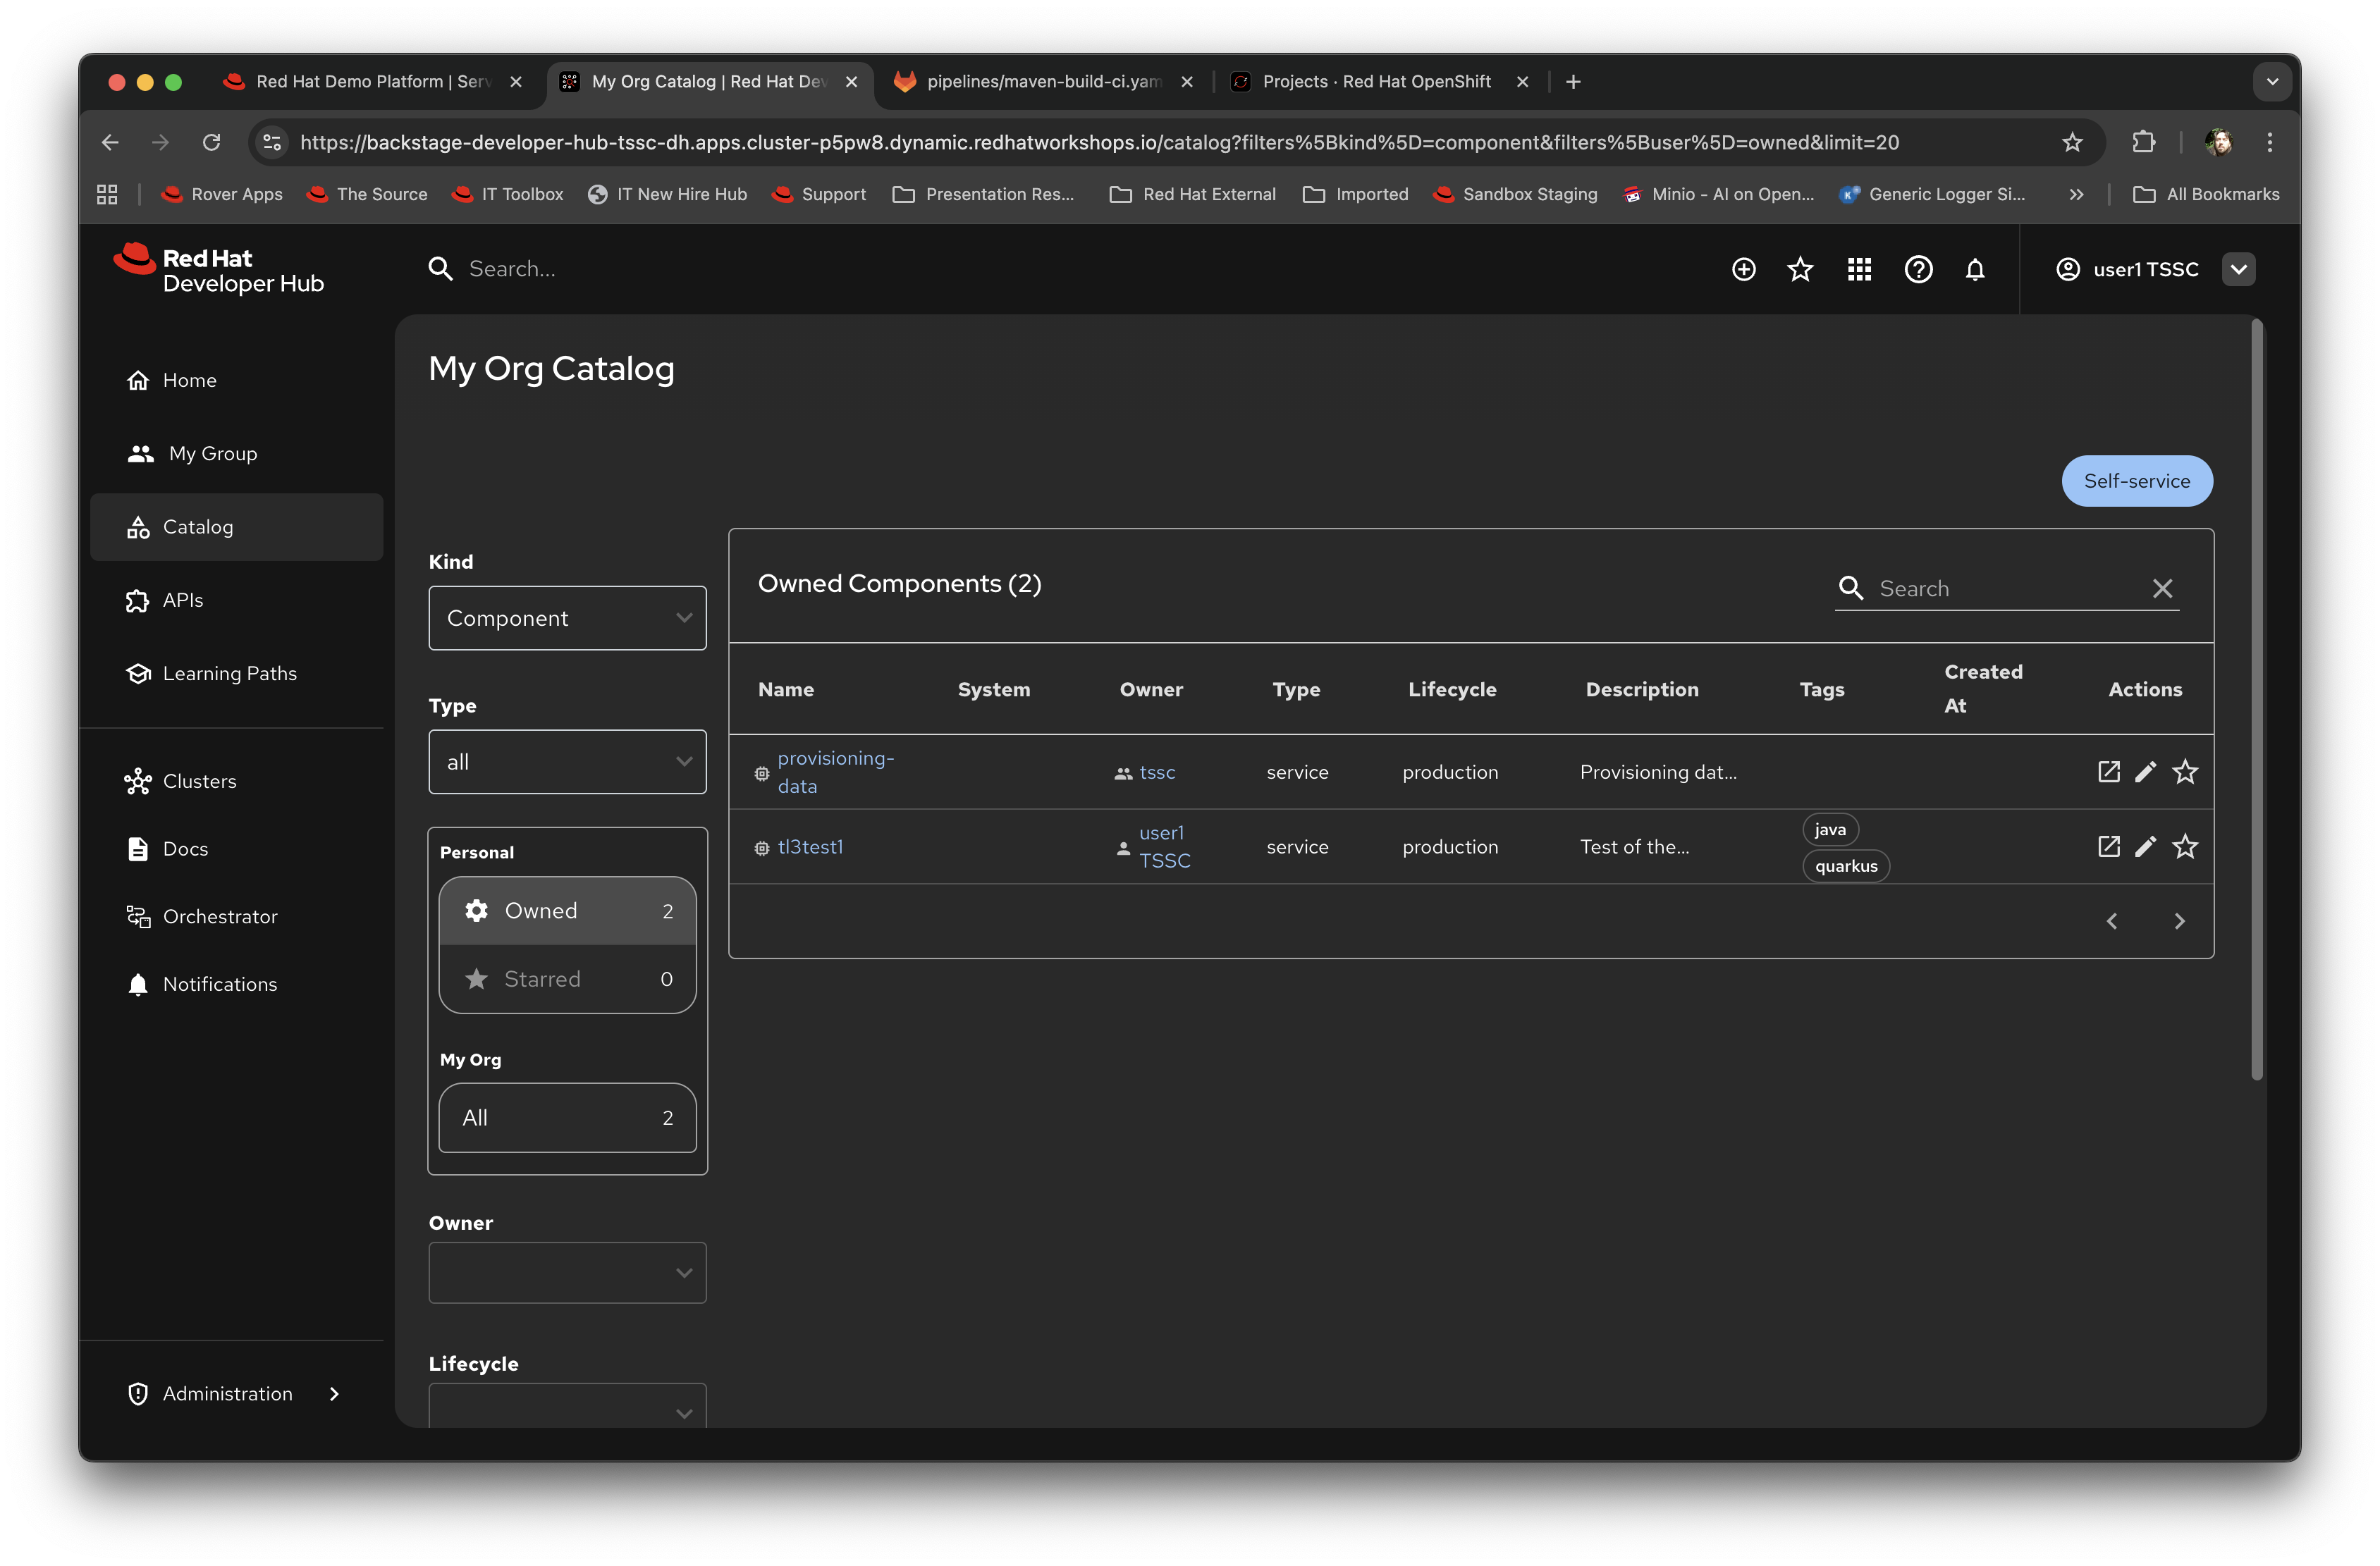
Click on Catalog on the left-hand navigation panel. This will default to showing the 'Components' you have access to; as discussed earlier in the modules, Red Hat Developer Hub works with a database of different types of objects and RBAC configuration which gives you access to them. In this case you should see a single service,
provisioning-data, which is a bootstrap service for adding user specific information to the templates.
Use the Self Service Template
-
In the top right you will see a plus button (+ icon) labelled Self Service. Click on it.
This will render all the templates currently registered in the system that you, as
{rhdh_user}, have access to. For the sake of this lab we are going to walk through the creation of a Quarkus application with secure build via TSSC. -
Scroll to the bottom of the tiles and you will see one labelled Securing a Quarkus Service Software Supply Chain (Tekton). Note the labels; as we described earlier the metadata of the template is rendered here as labels to assist developer selection. Click on it.
This is where the power of templates starts to shine; if you remember looking at the structure in the earlier section we described the use of parameters that the framework interprets as a wizard; we are now seeing that in action.
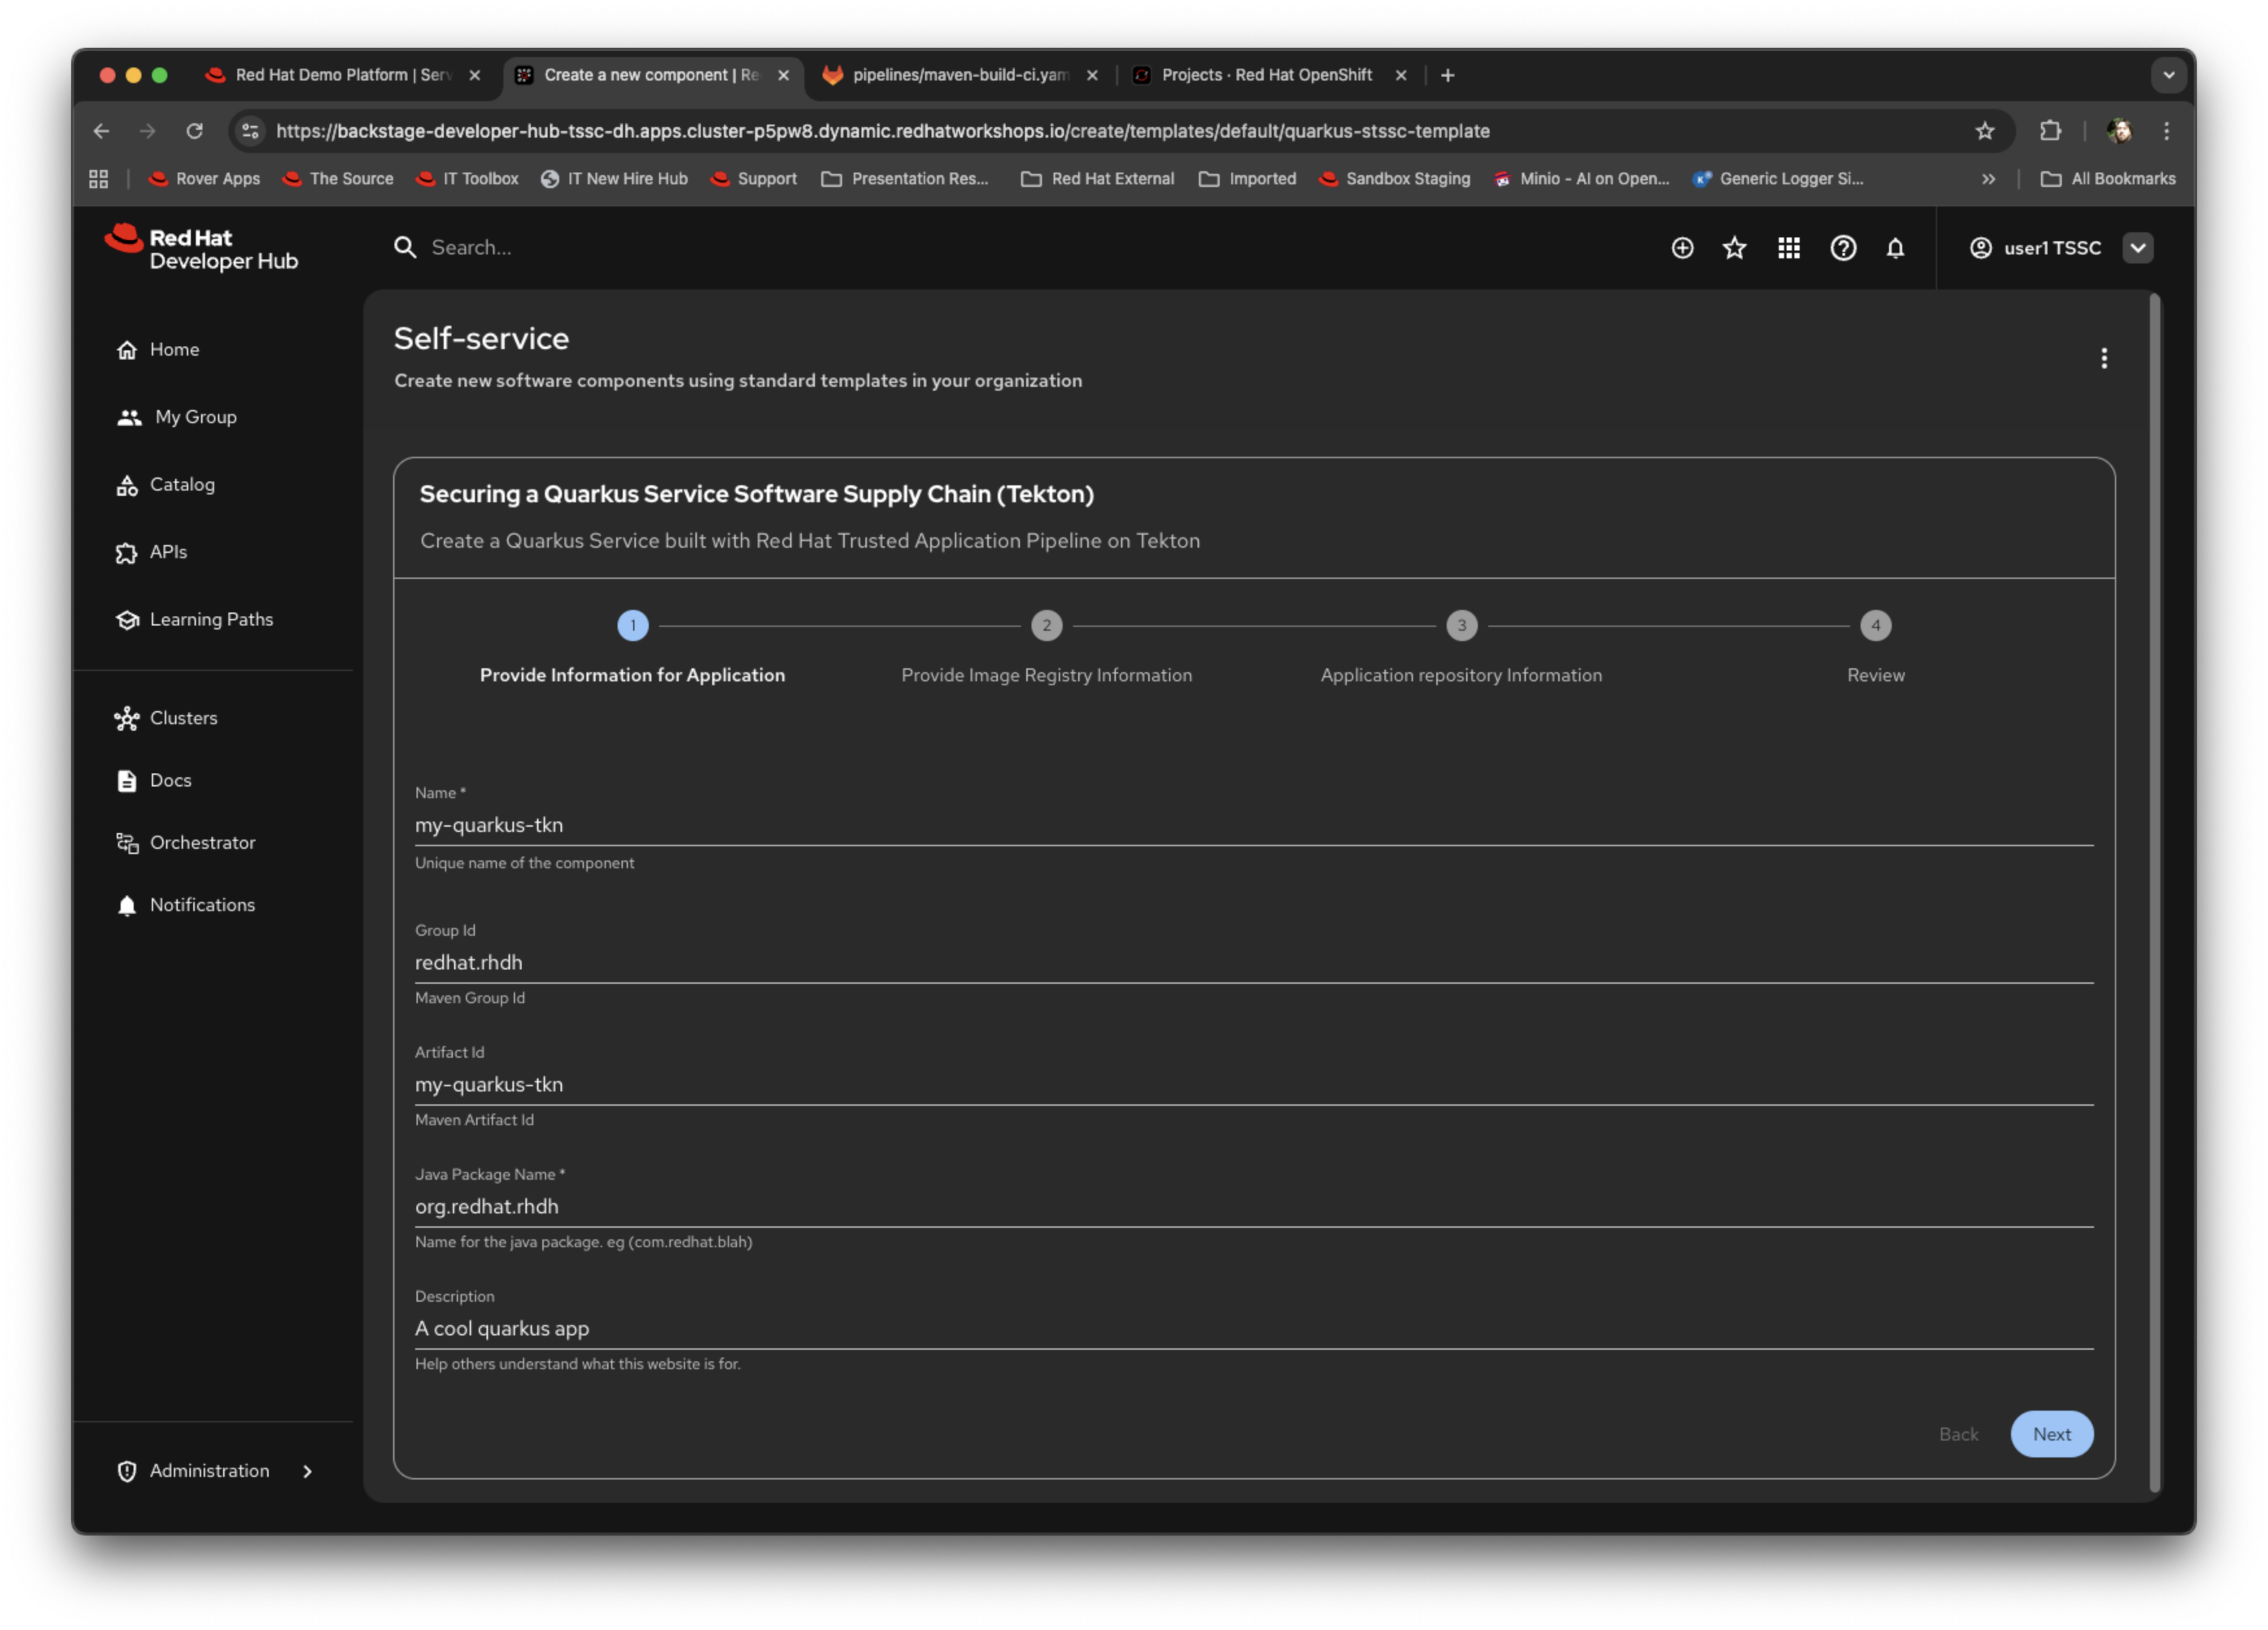
Notice the breadcrumb trail at the top; this matches the individual parameter sections we described previously.
-
Change the name of the component to
tl3test1. Change the artifact ID totl3test1as well. Change the description to something different. Click Next.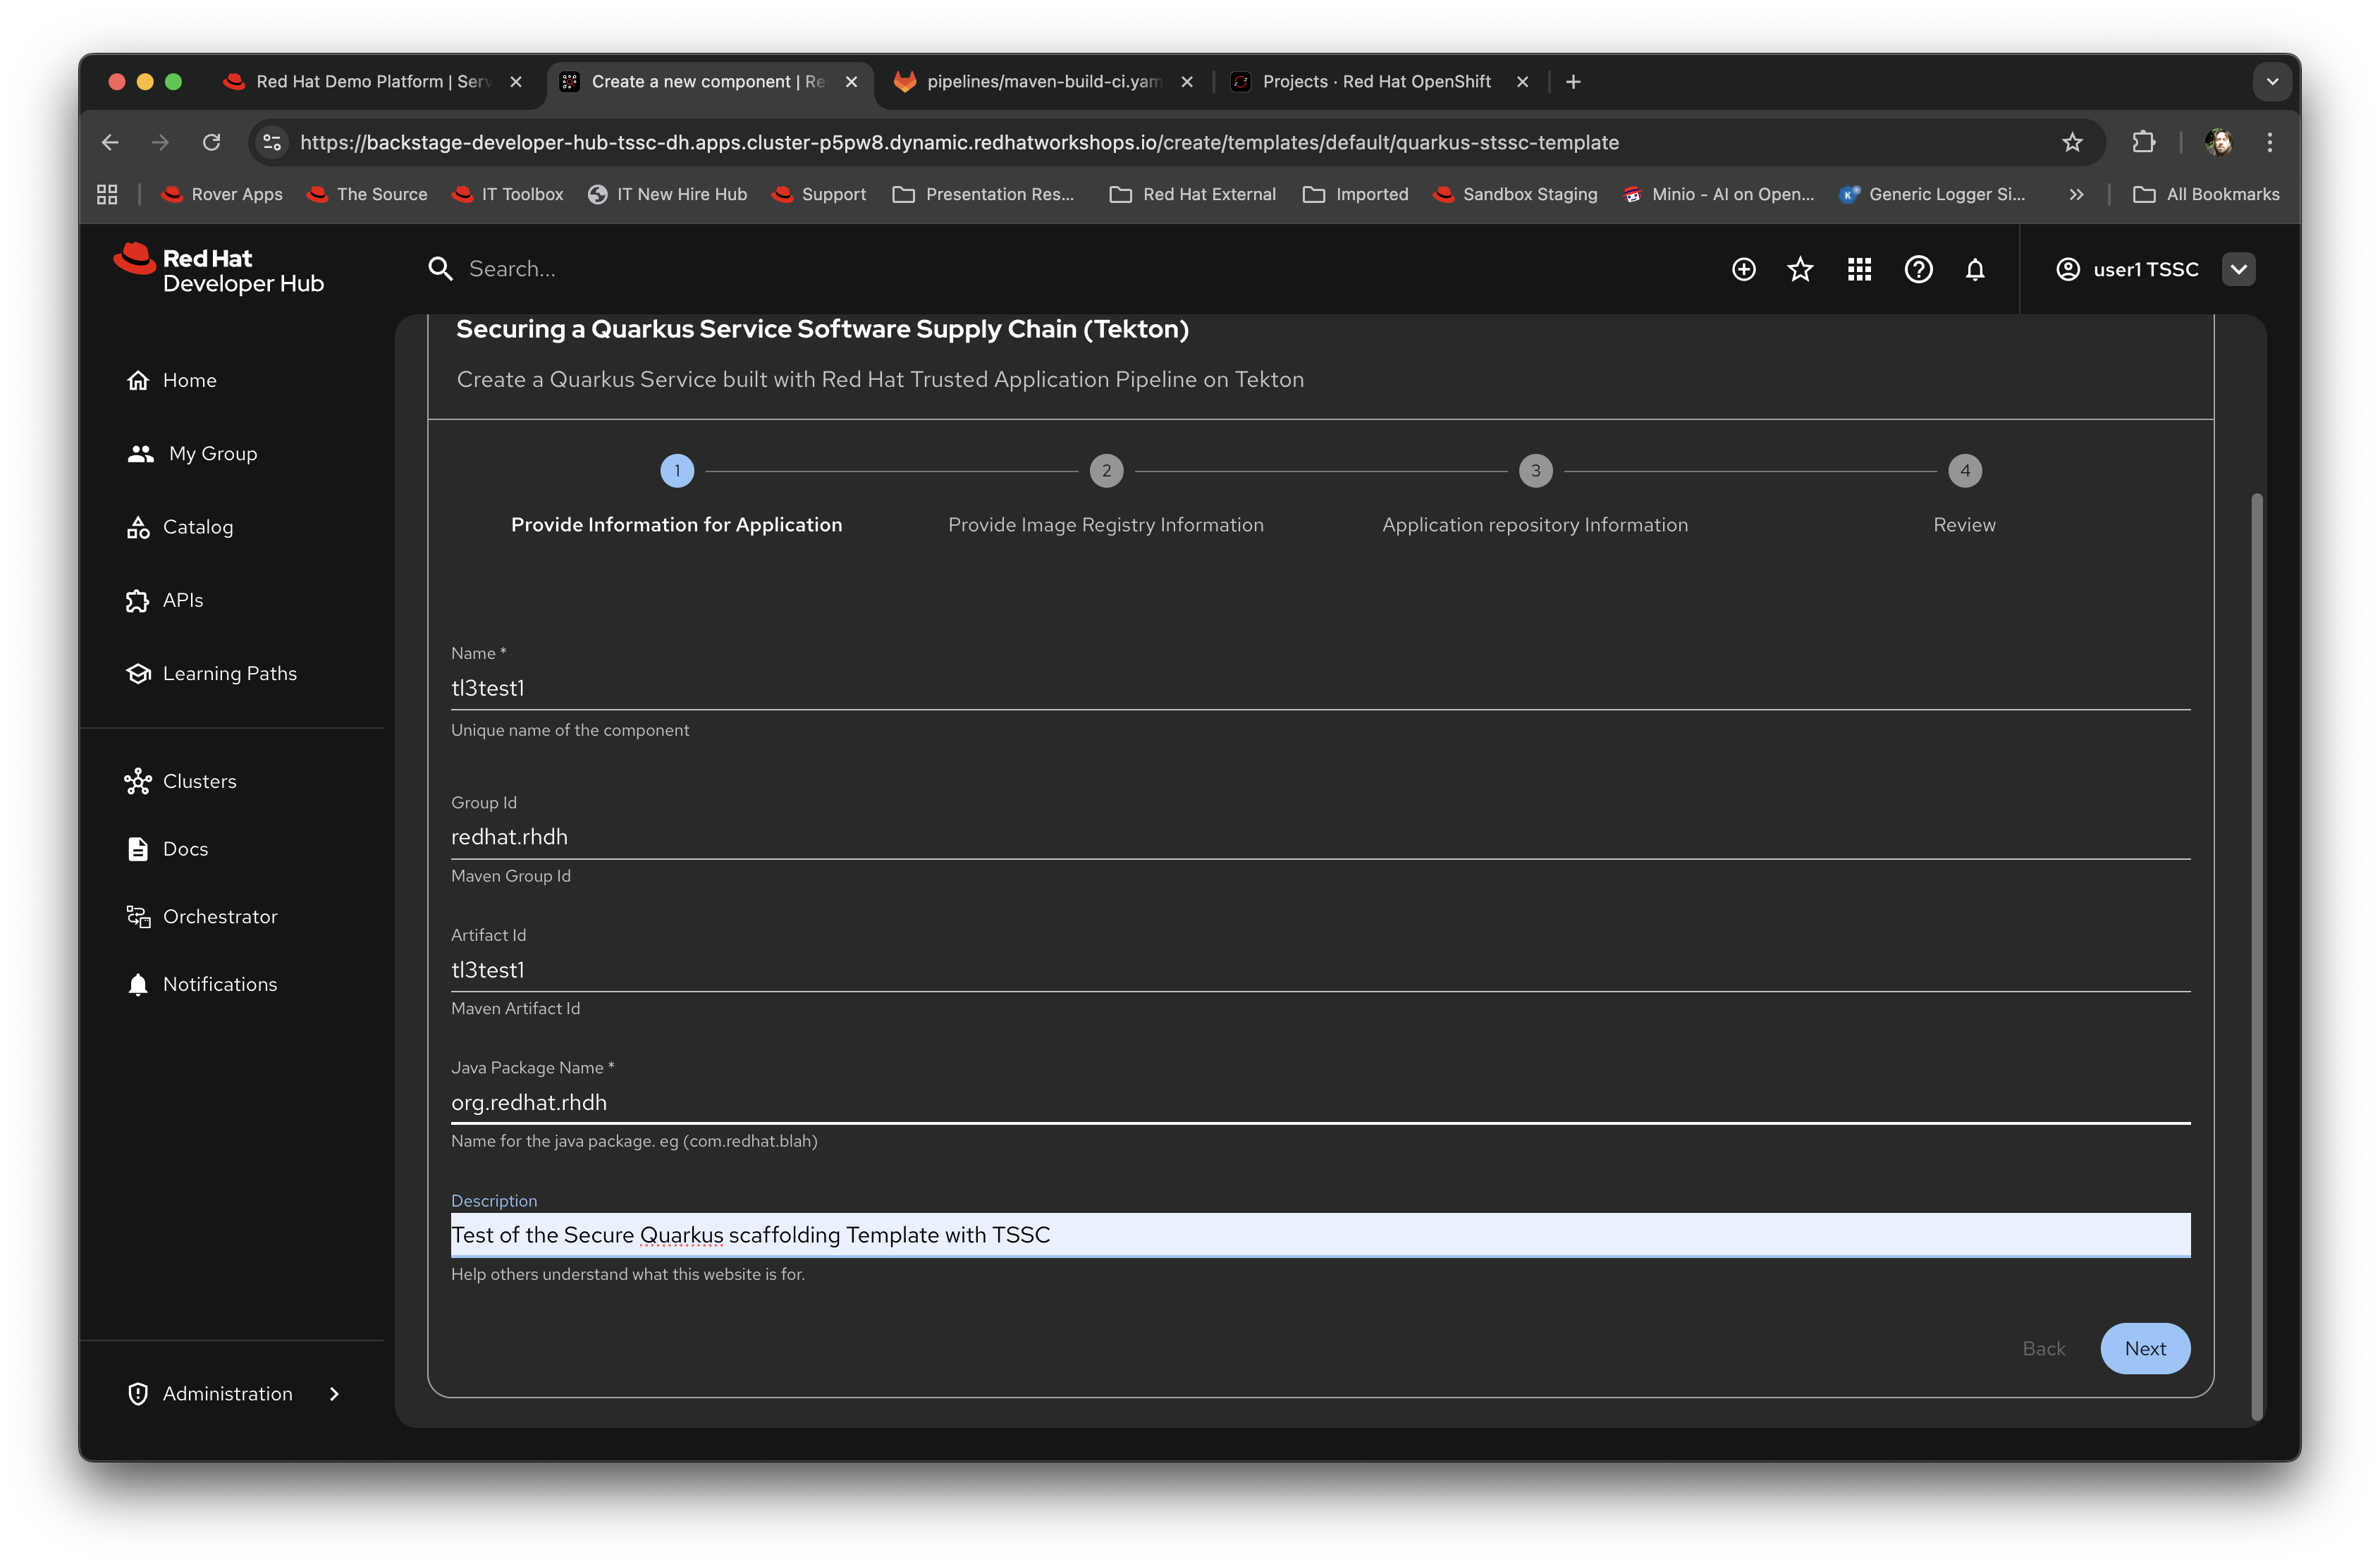
-
Now you will see the Registry parameters; you can leave these as they are (the demo has its own instance of Quay installed and the organisation setup correctly). Click Next.
-
The next wizard prompts for the repository information; again, leave as is as the demo has GitLab setup and integrated. Click Review.
-
The final generated content page contains a summary of the information you have provided; click on Create to start the process of executing the template within Red Hat Developer Hub.
The template will process all of the defined steps and give you a real-time view of the progress. It should succeed at this point and the screen will look like this:
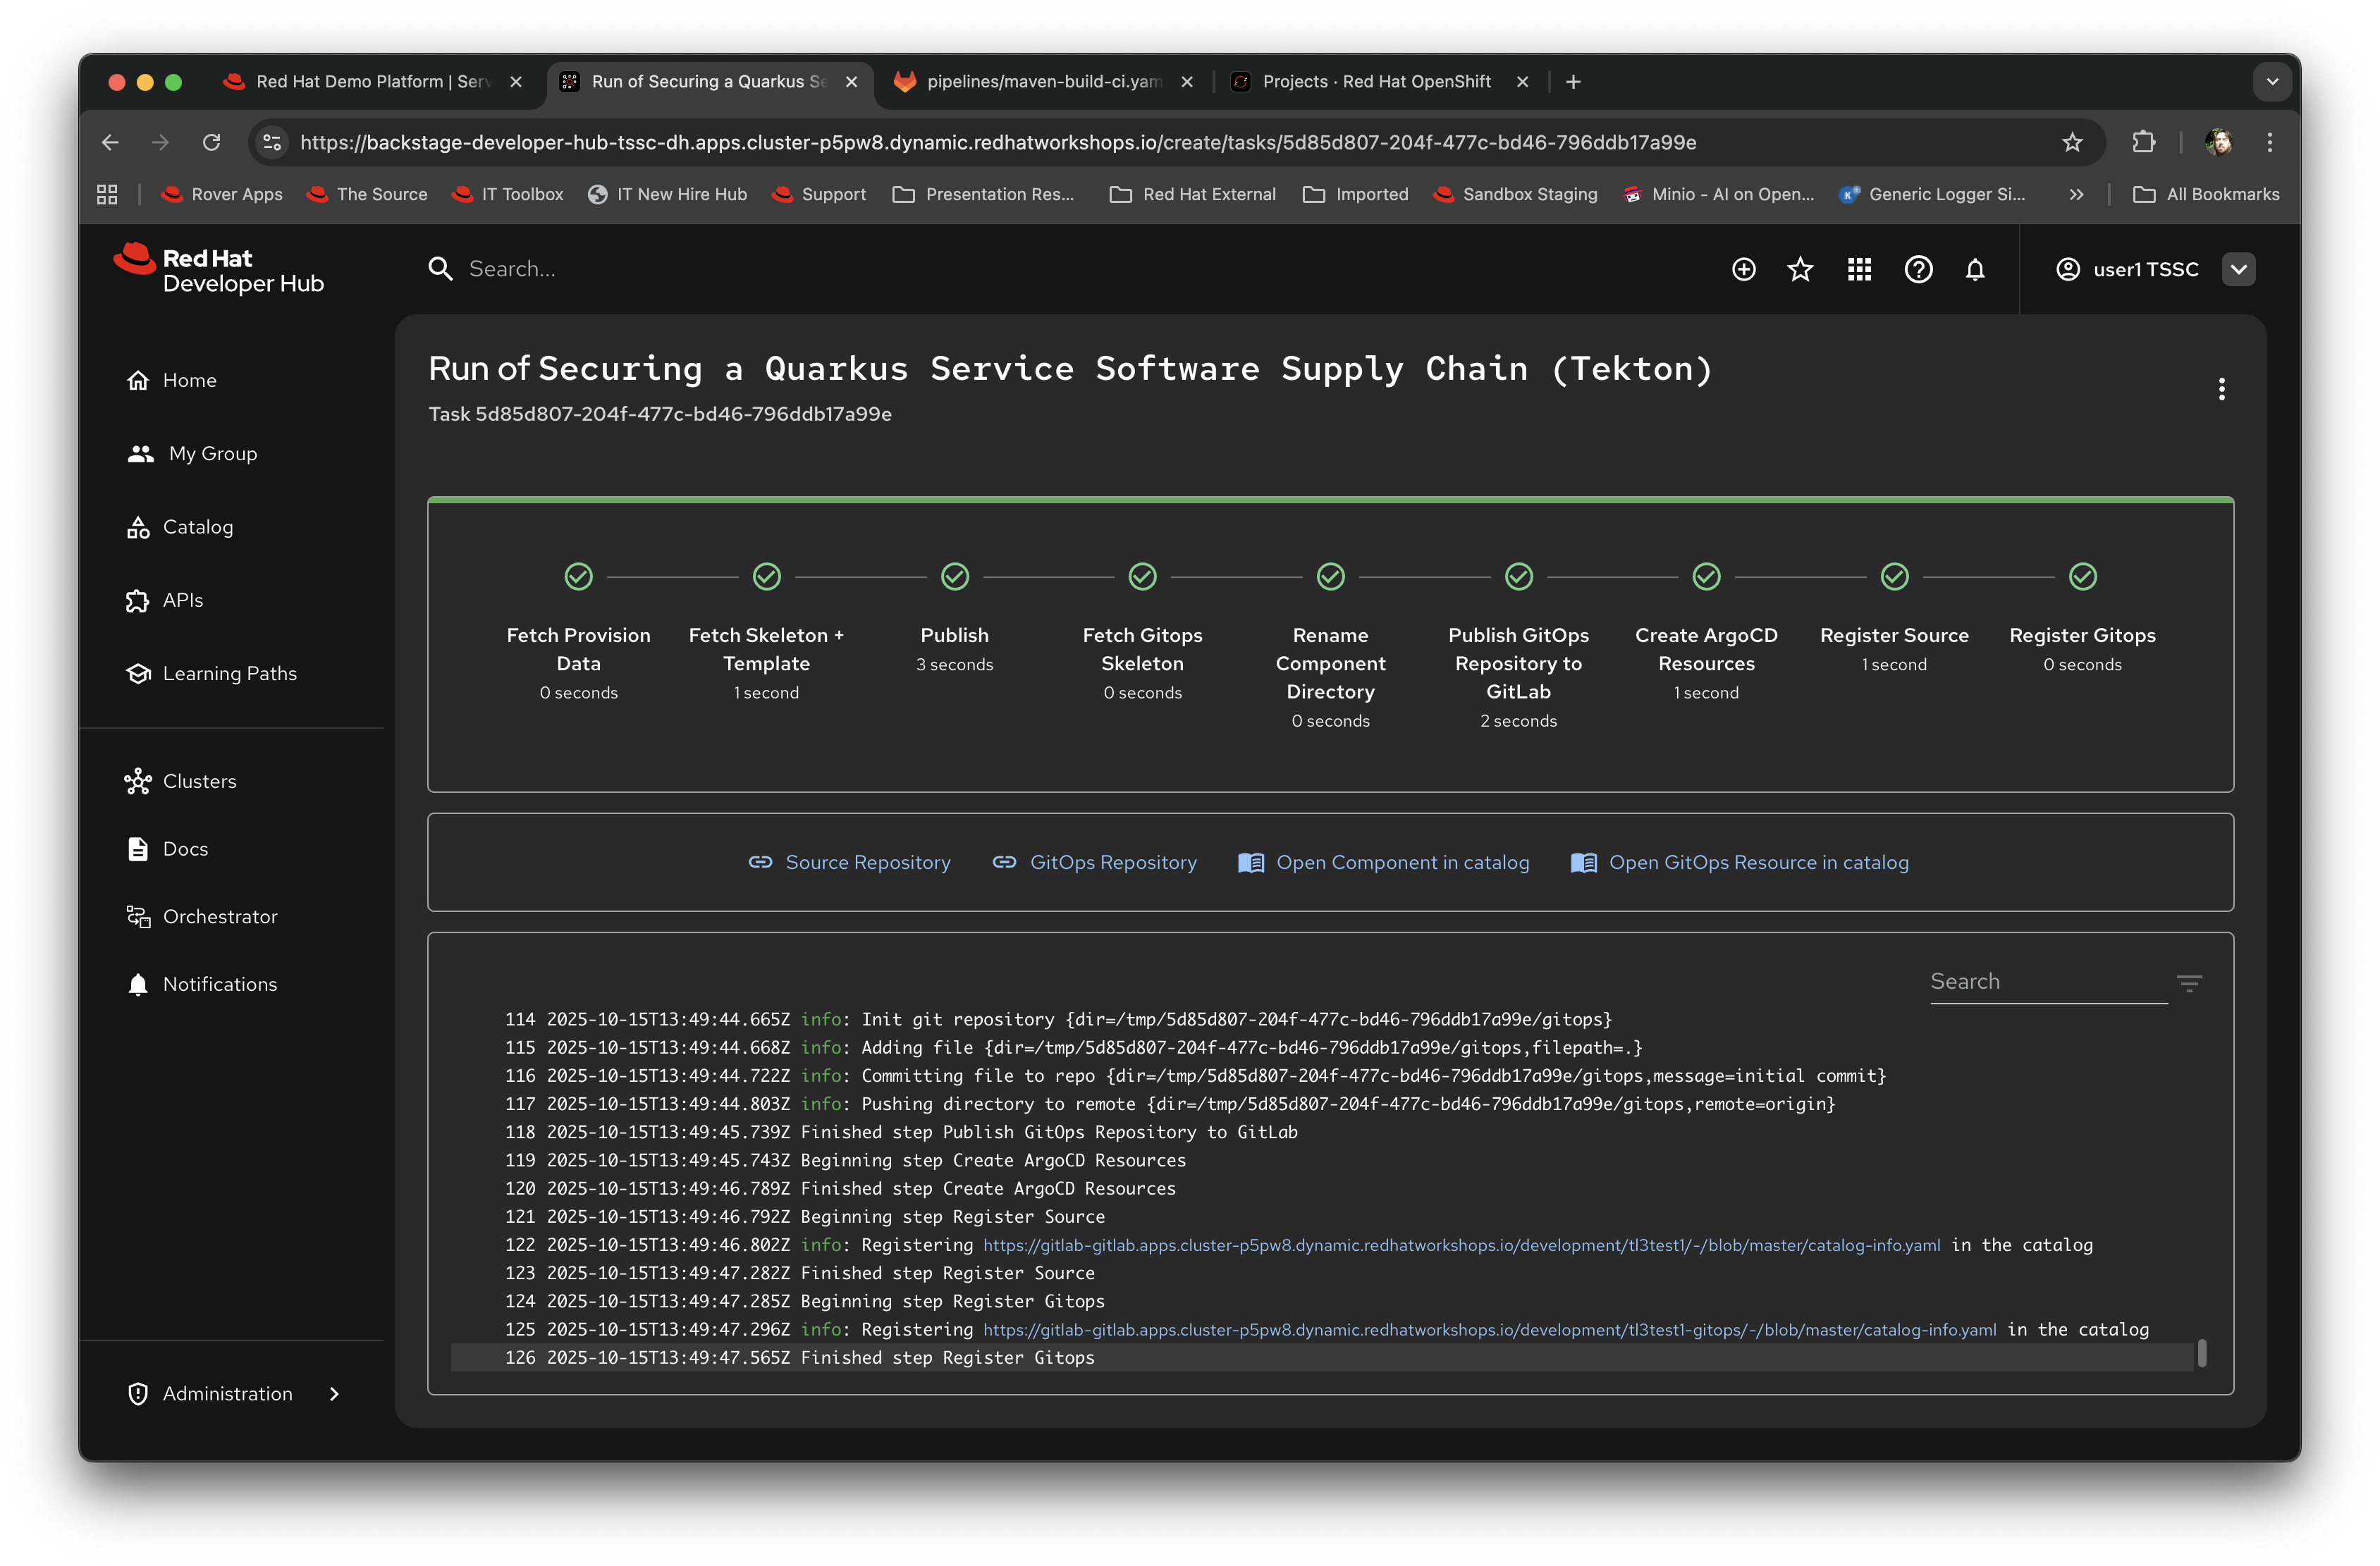
It is worth scrolling up in the log and looking at the output of each step to see what it is doing - in particular look at the Fetch Skeleton and Template step; it lists all the files it is marshalling before it commits them to the new git repository it creates. The look at the log for the Fetch gitops skeleton step and you will see the GitOps definitions being marshalled and setup. The Publish and Publish GitOps steps create the required repositories, and the Create ArgoCD Resources step instantiates the required (and instance configured) versions of the applications (in this case Application refers to an ArgoCD application - more later).
At this point the template has completed and generated all the scaffolding for the developer; note the four outputs (defined in the template) rendered as icon/text beneath the rendering of the completed template - in addition to generating the source and GitOps repositories, Red Hat Developer Hub generates Component objects to back these within the Red Hat Developer Hub database. What we are going to do now is look at exactly what has happened behind the scenes.
What has been Scaffolded?
Let’s take a look at what has been scaffolded by the template.
-
First, click on the Catalog navigation link again. You will see you now have an active component (the result of the completed template).
-
Click on the name of the component. This takes you to the core interaction content page for the developer, which should look similar to this:
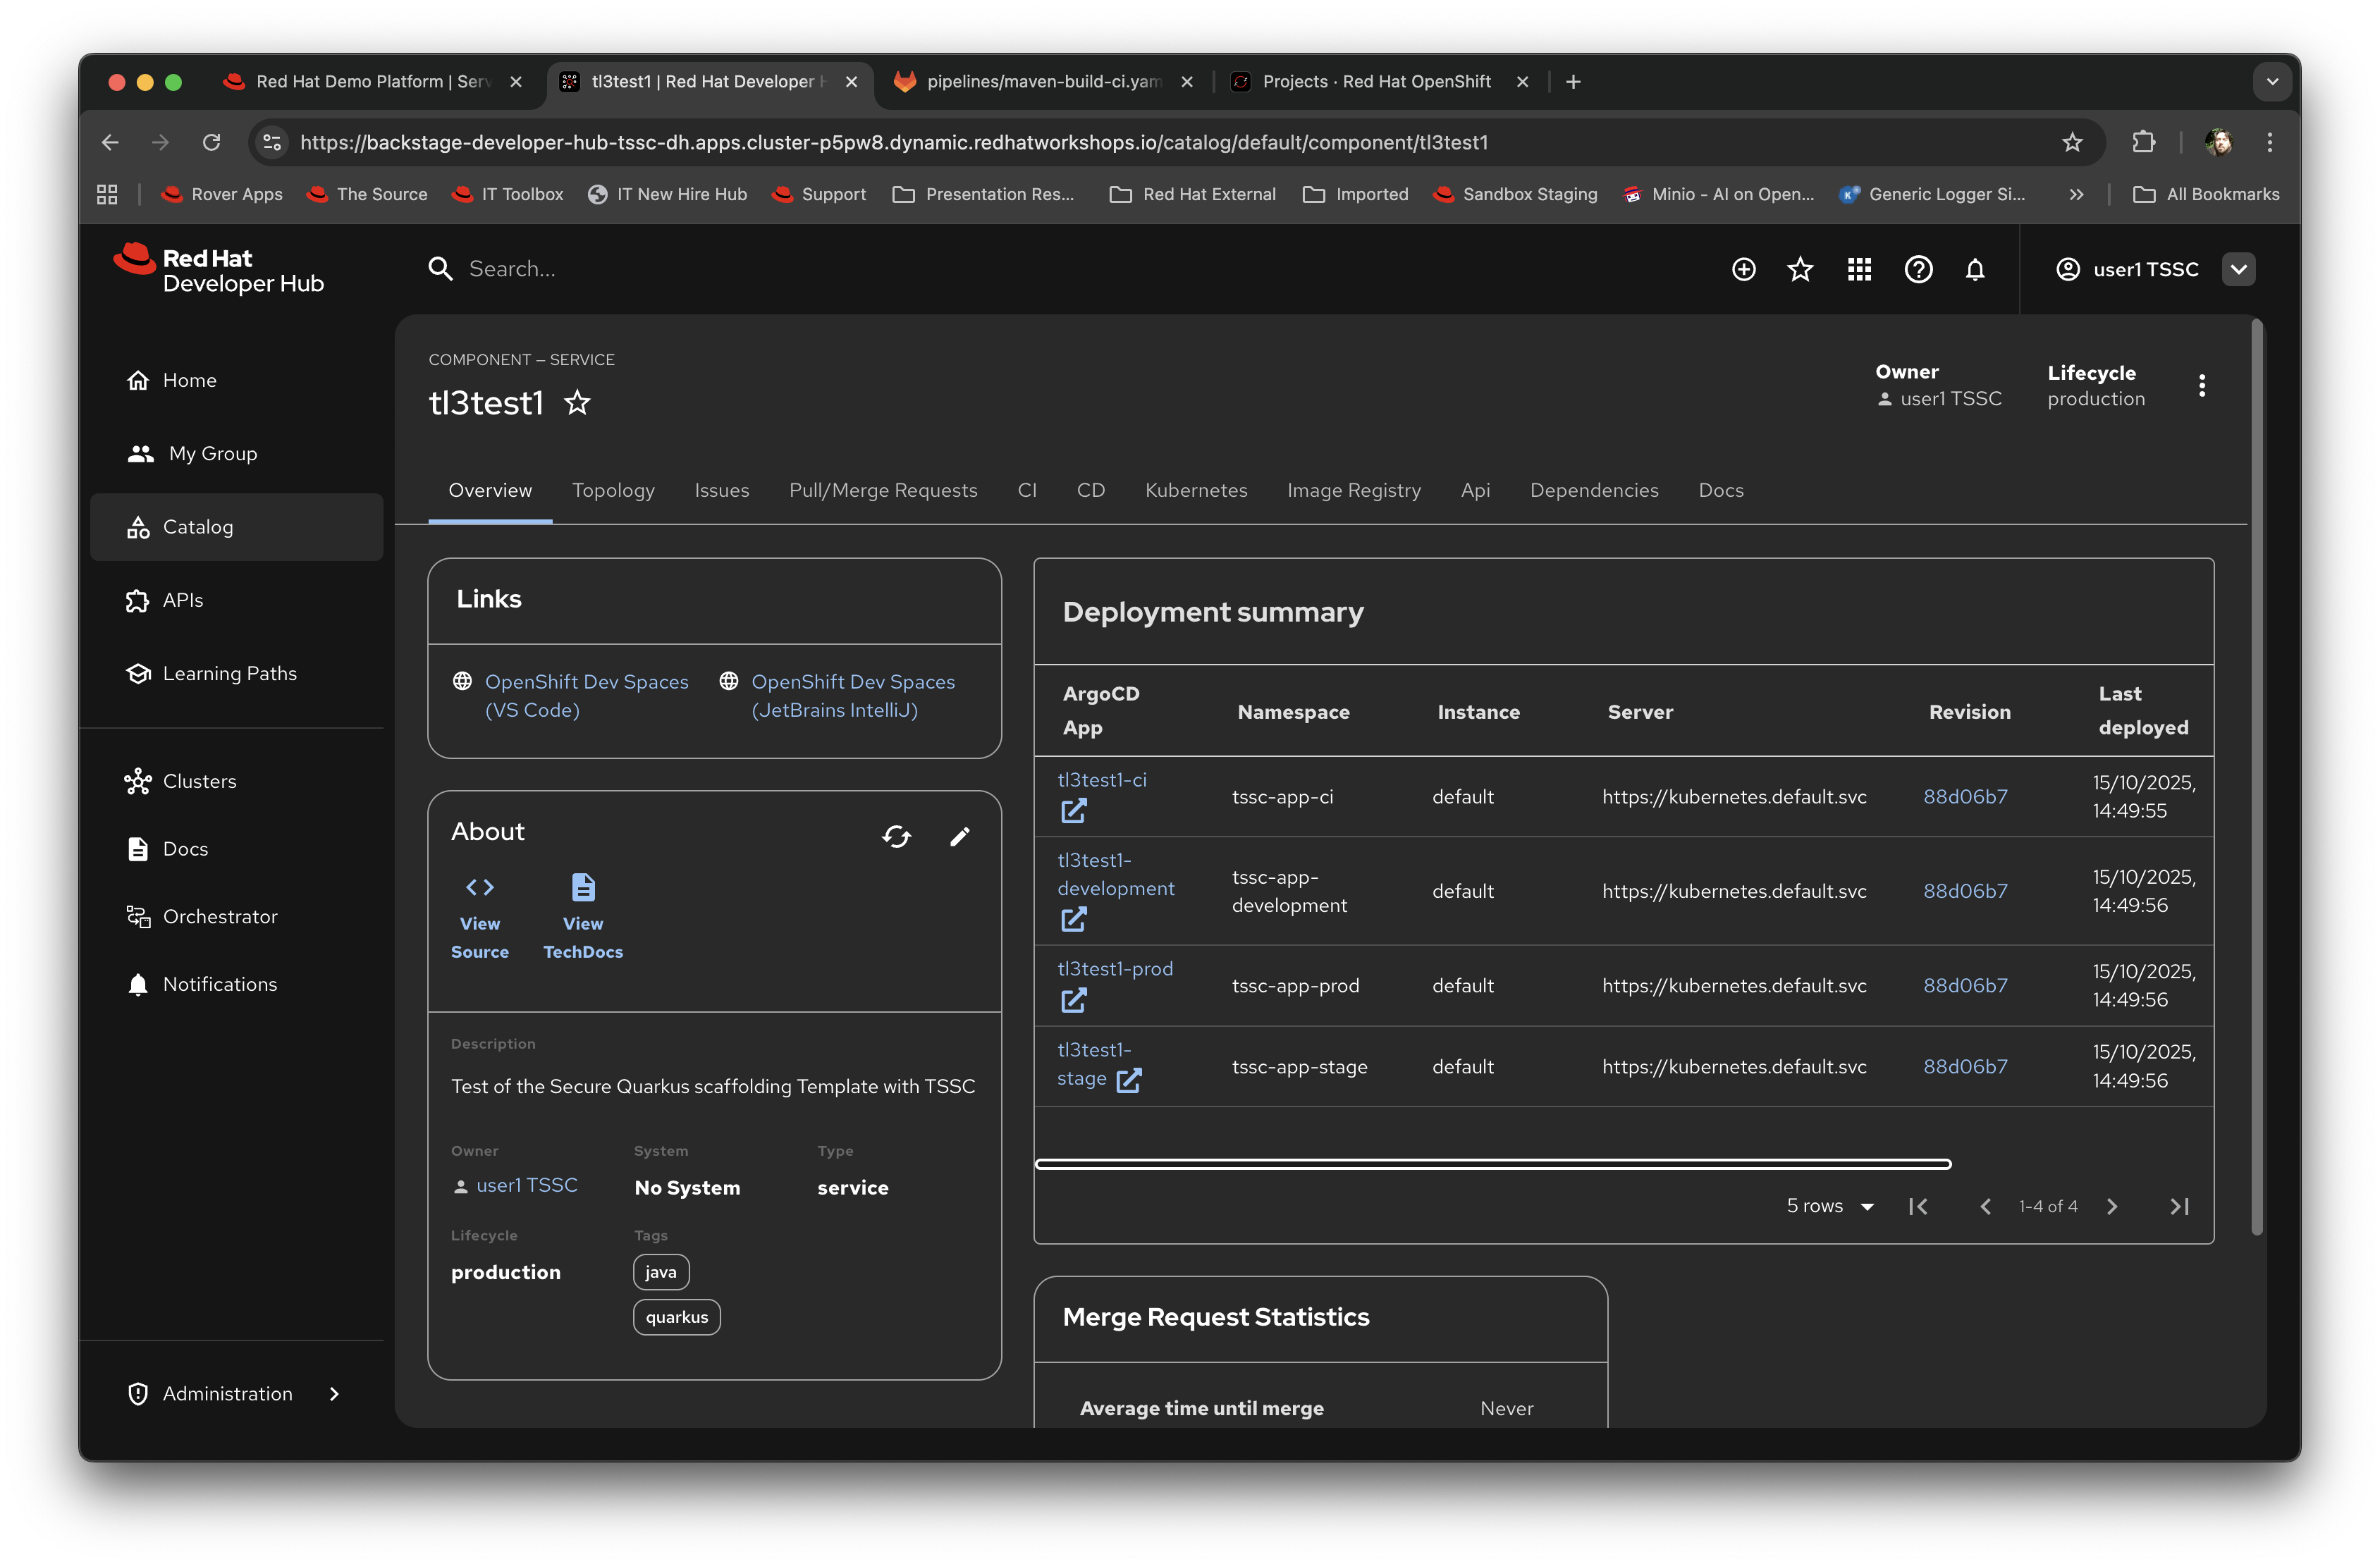
This is a very powerful part of the Red Hat Developer Hub offering; the sub-tabs on this page are generated by the plugins added to the framework (see earlier modules).
-
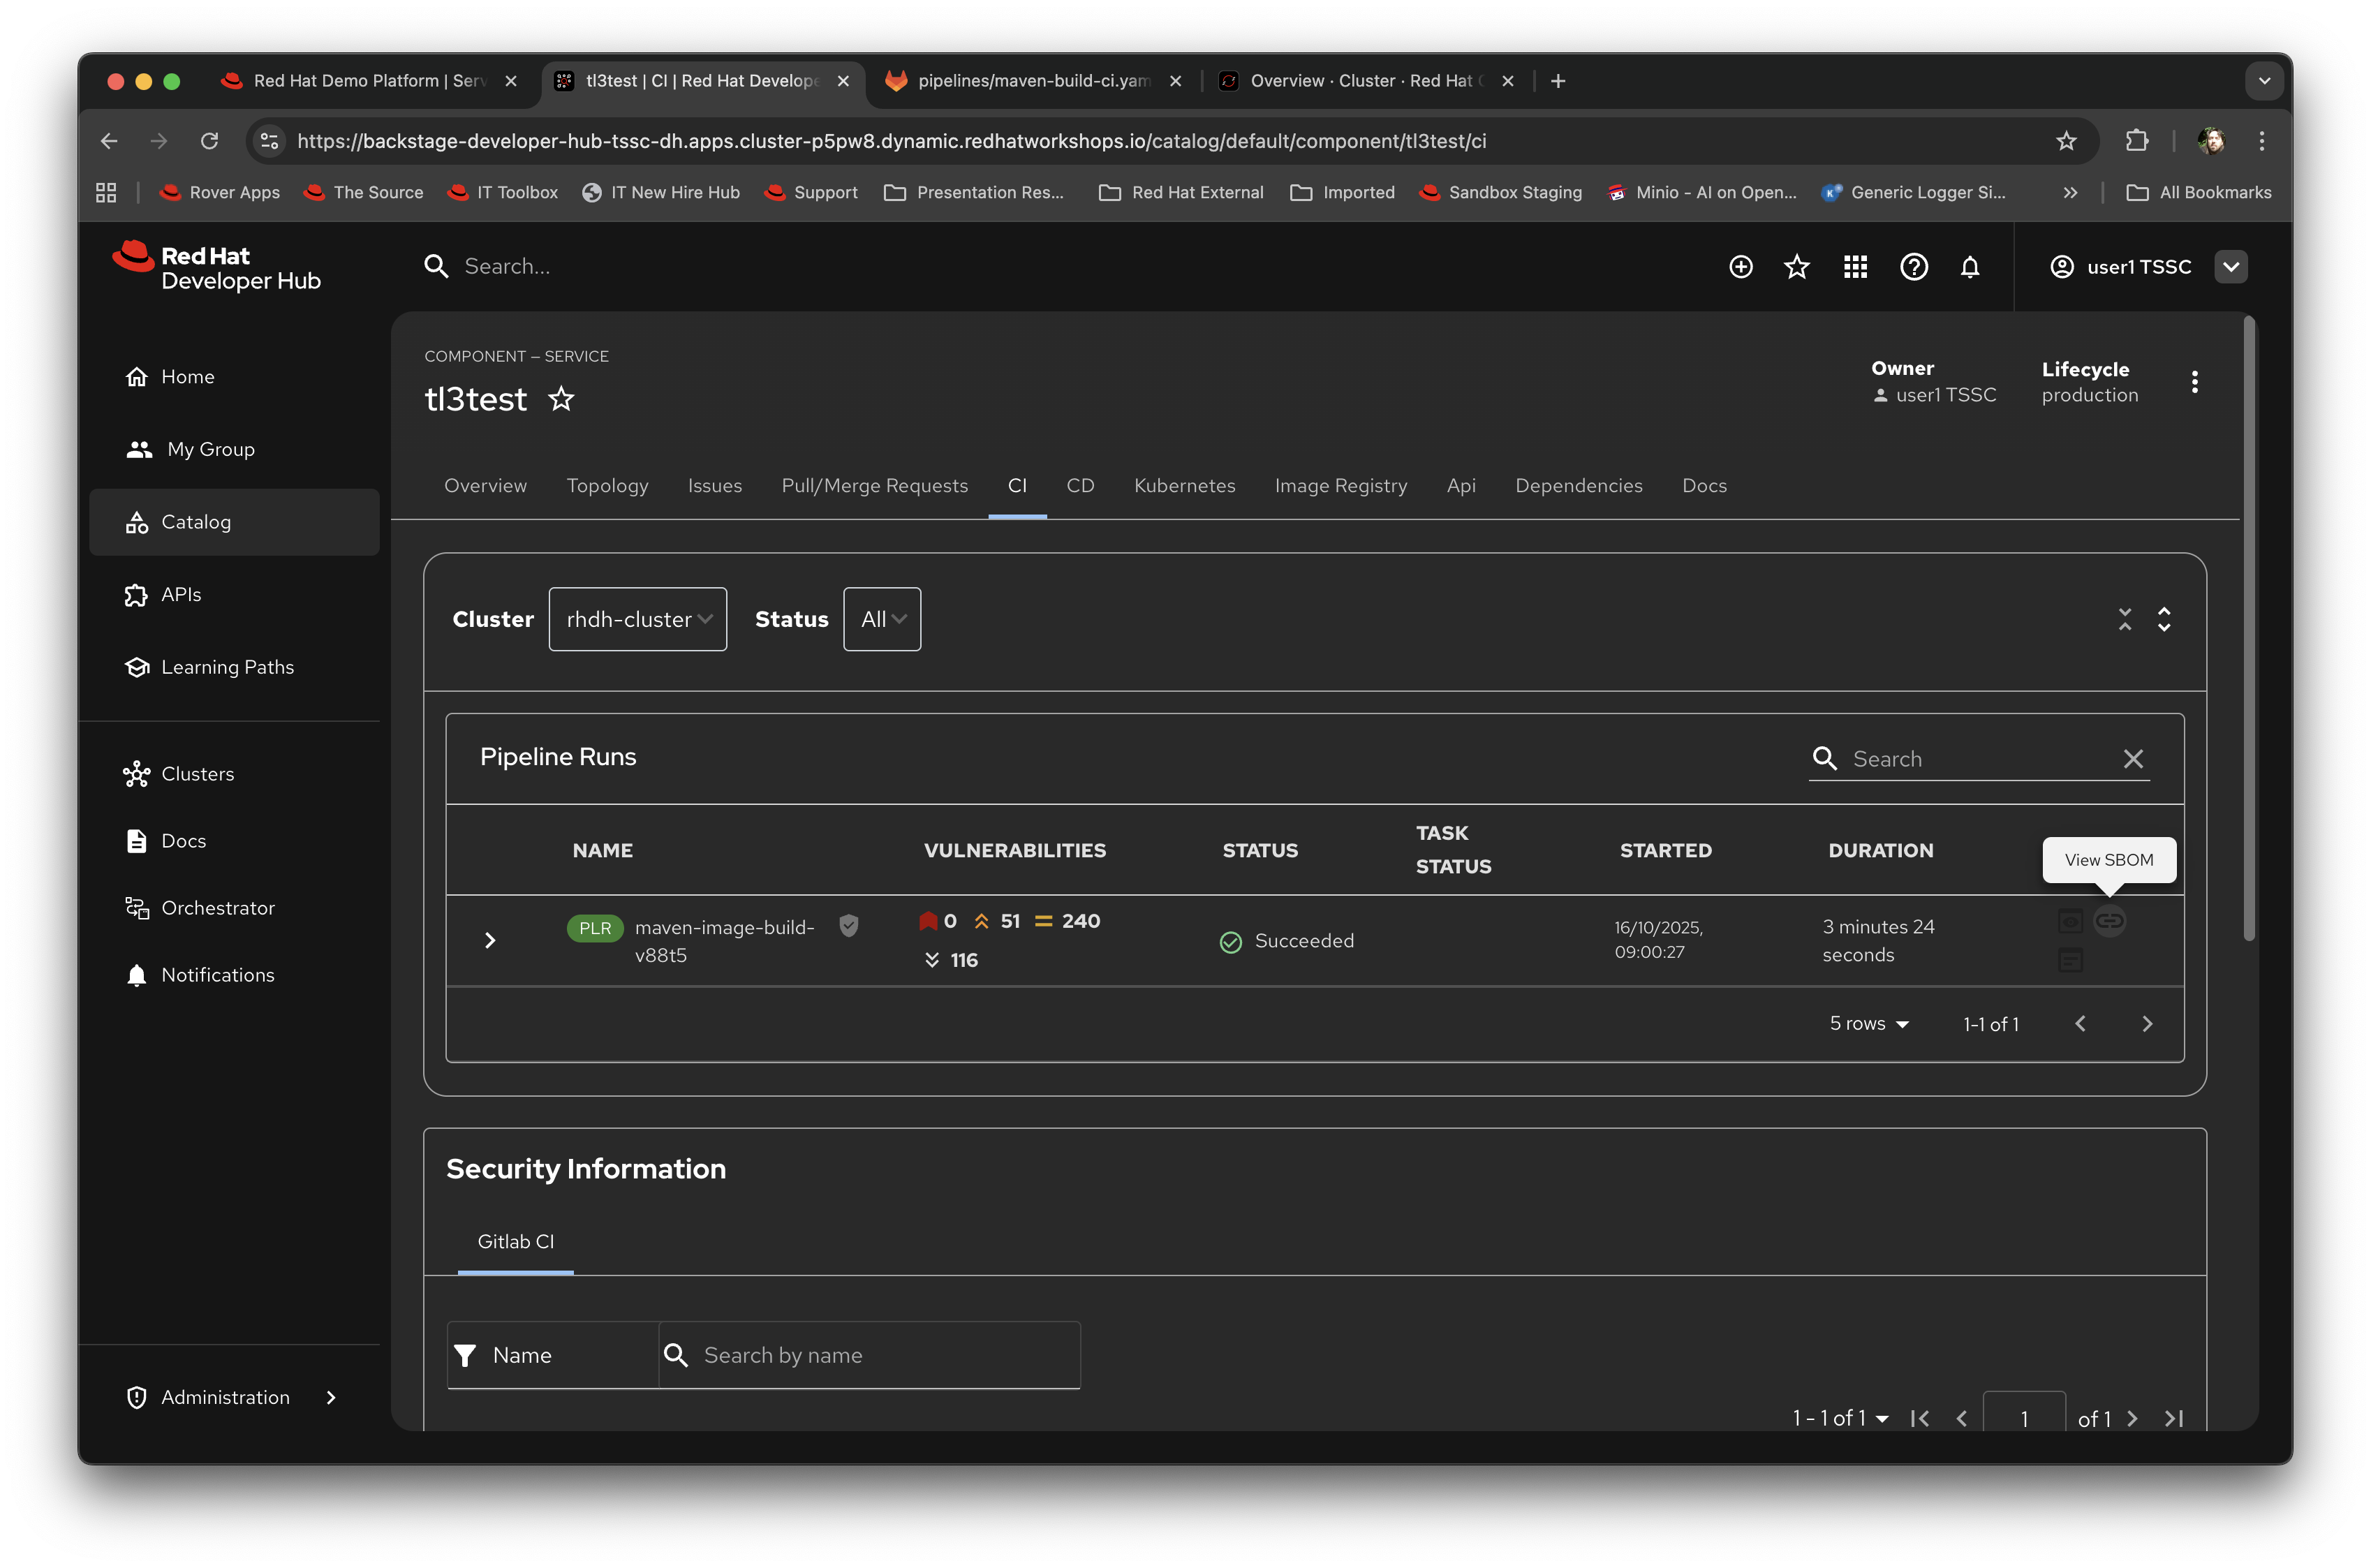
If you now click on CI (and assuming you have waited a couple of minutes) the TSSC pipeline will have completed, using the base repository and code.
Occasionally you may see an issue where the Quay repository has expired the logon, especially if you leave the lab open for a long while; if the pipeline fails at this point, simply go to the {quay_url}[Quay Console^] and login again using the
{quay_admin_user}username and the password:{quay_admin_password}. This will re-set the expiration of the access token, and your next commit and pipeline run will be successful later on in this exercise, so just ignore the error for now. -
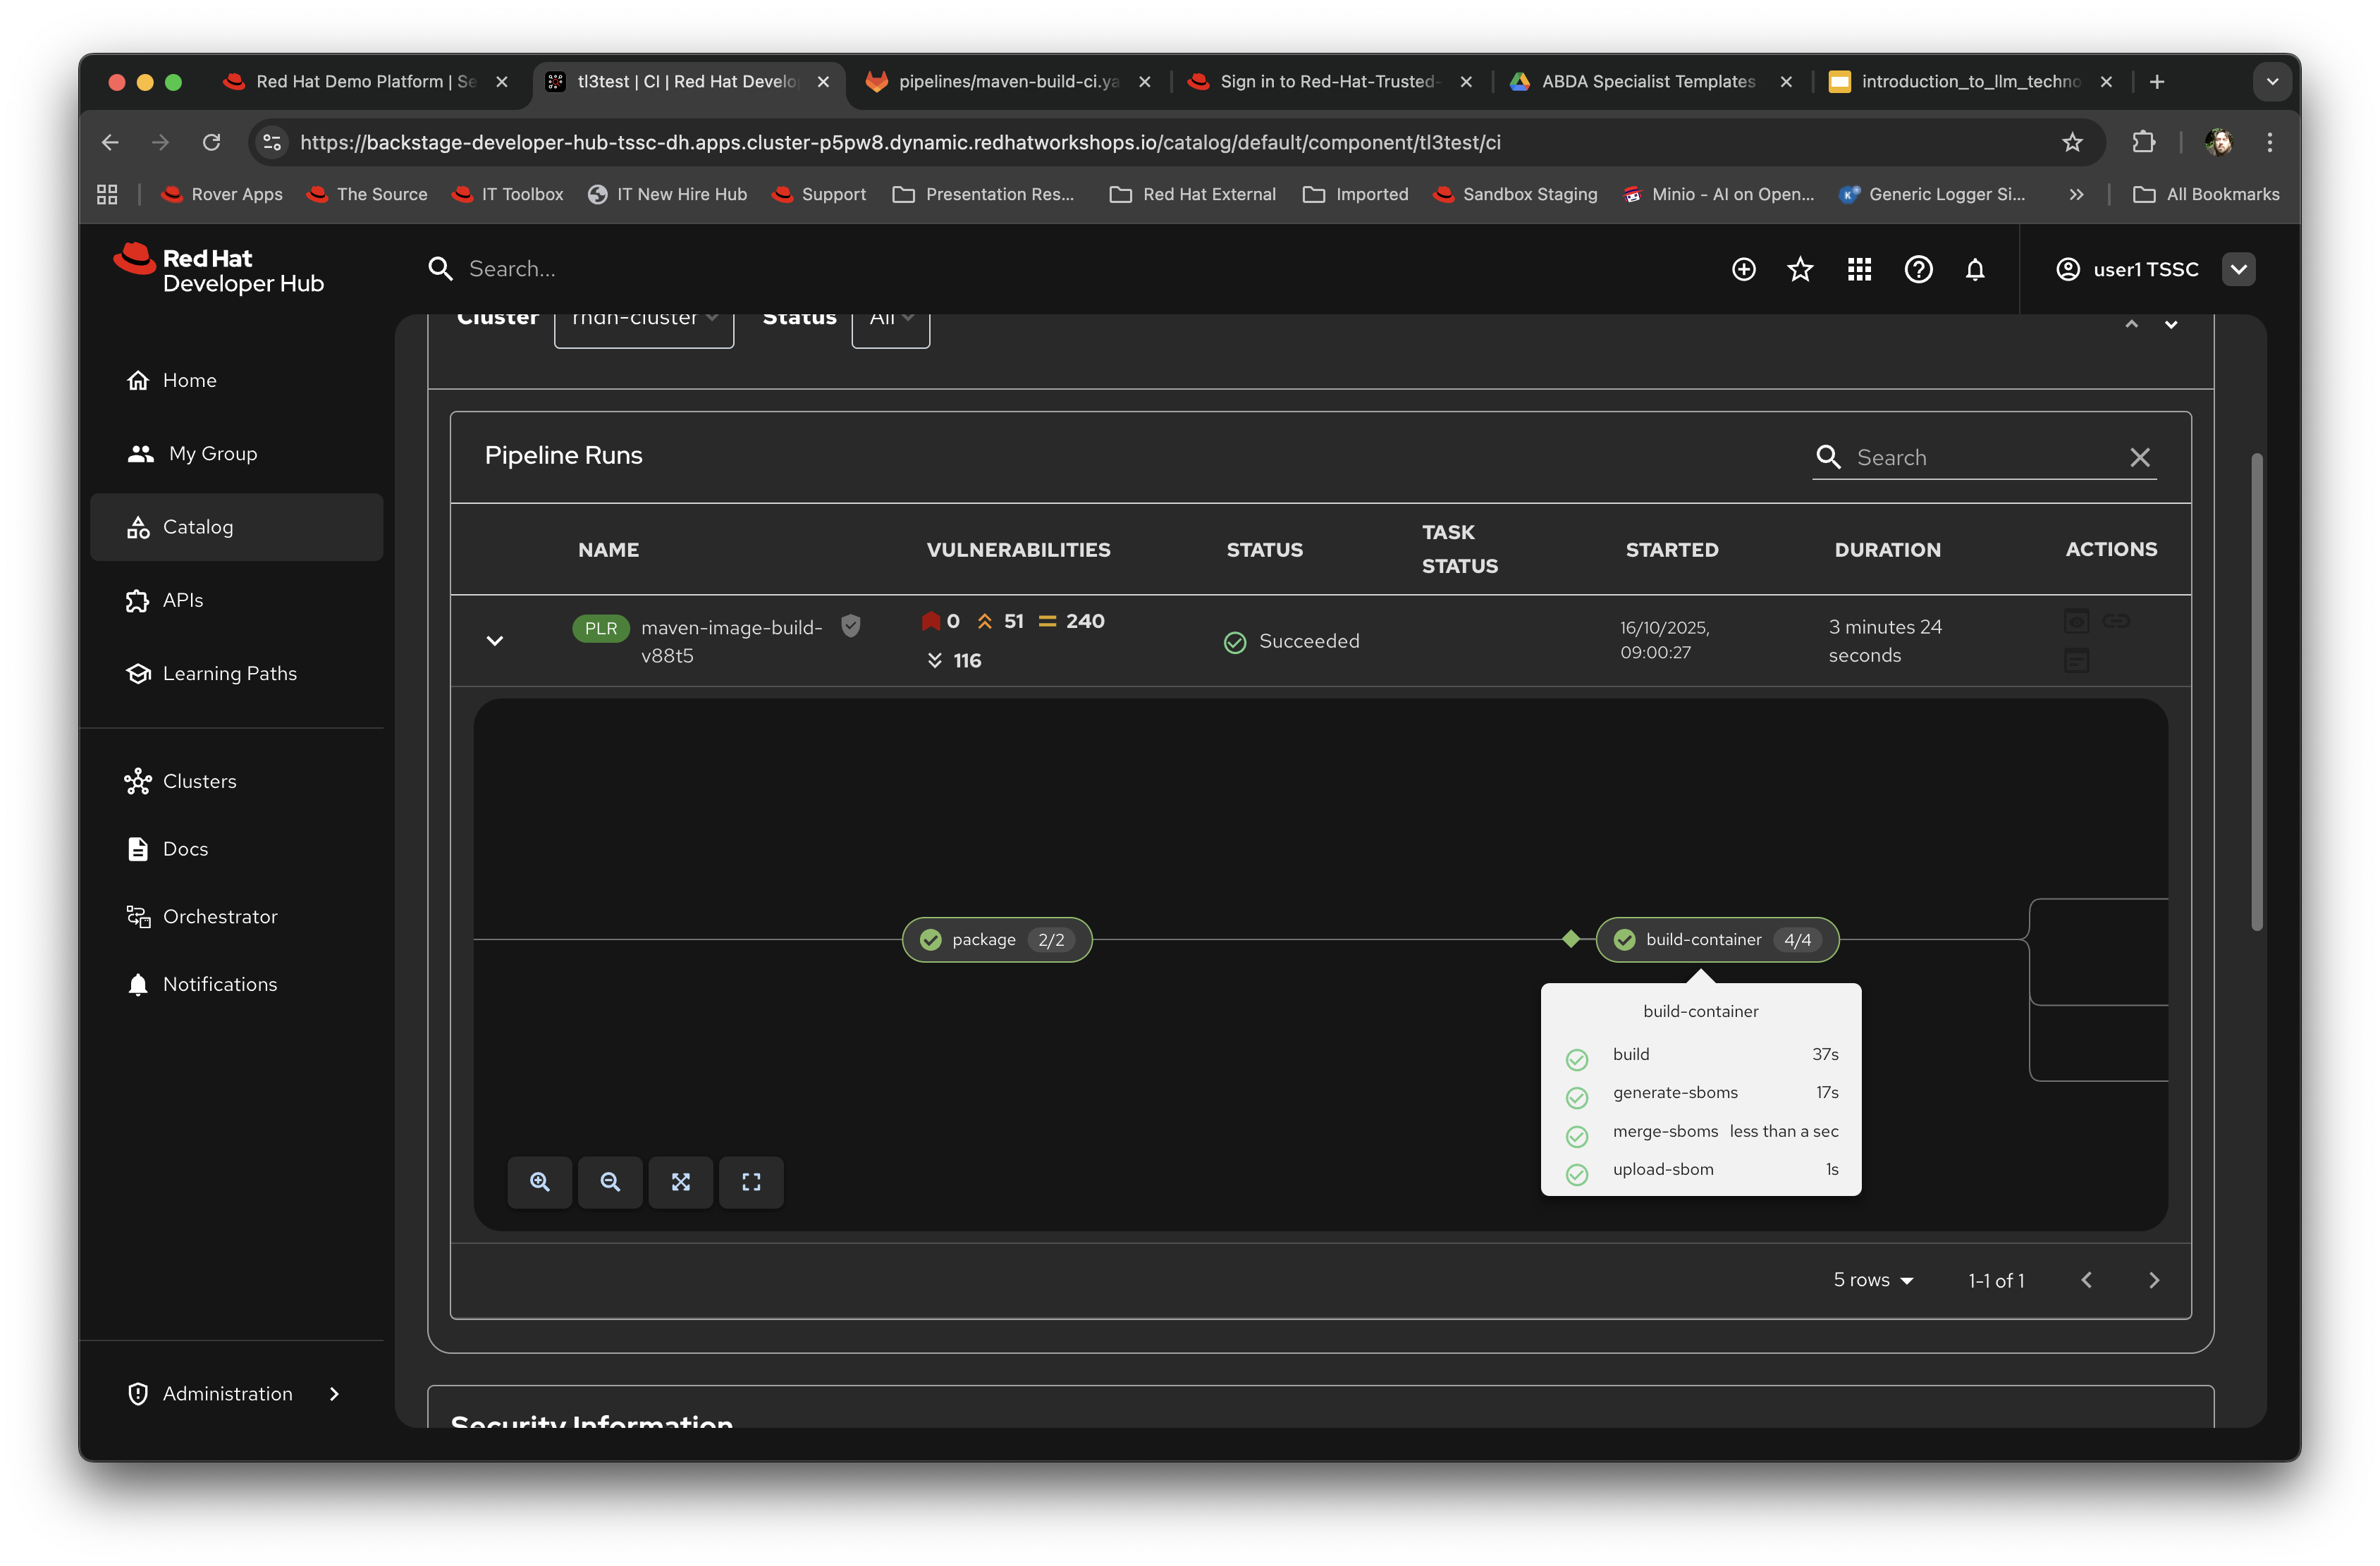
Expand the information panel for the Pipeline Run (the small arrow at the left) and you will see the output of the pipeline that was automatically executed as part of the creation of the git repo. Notice the icon indication of the potential vulnerabilities shown as part of the run as well.
You can use the cursor to move around the pipeline. As an example click on the 'Build Container' step and it will show you the direct logs of the processes executed as part of that process:
-
Now click on the Topology tab. This will render the plugin for visualising the application running on the target cluster; this is another strength of the Red Hat Developer Hub approach, it removes the need for a developer to login and navigate to the appropriate screens in the OpenShift Web Console.
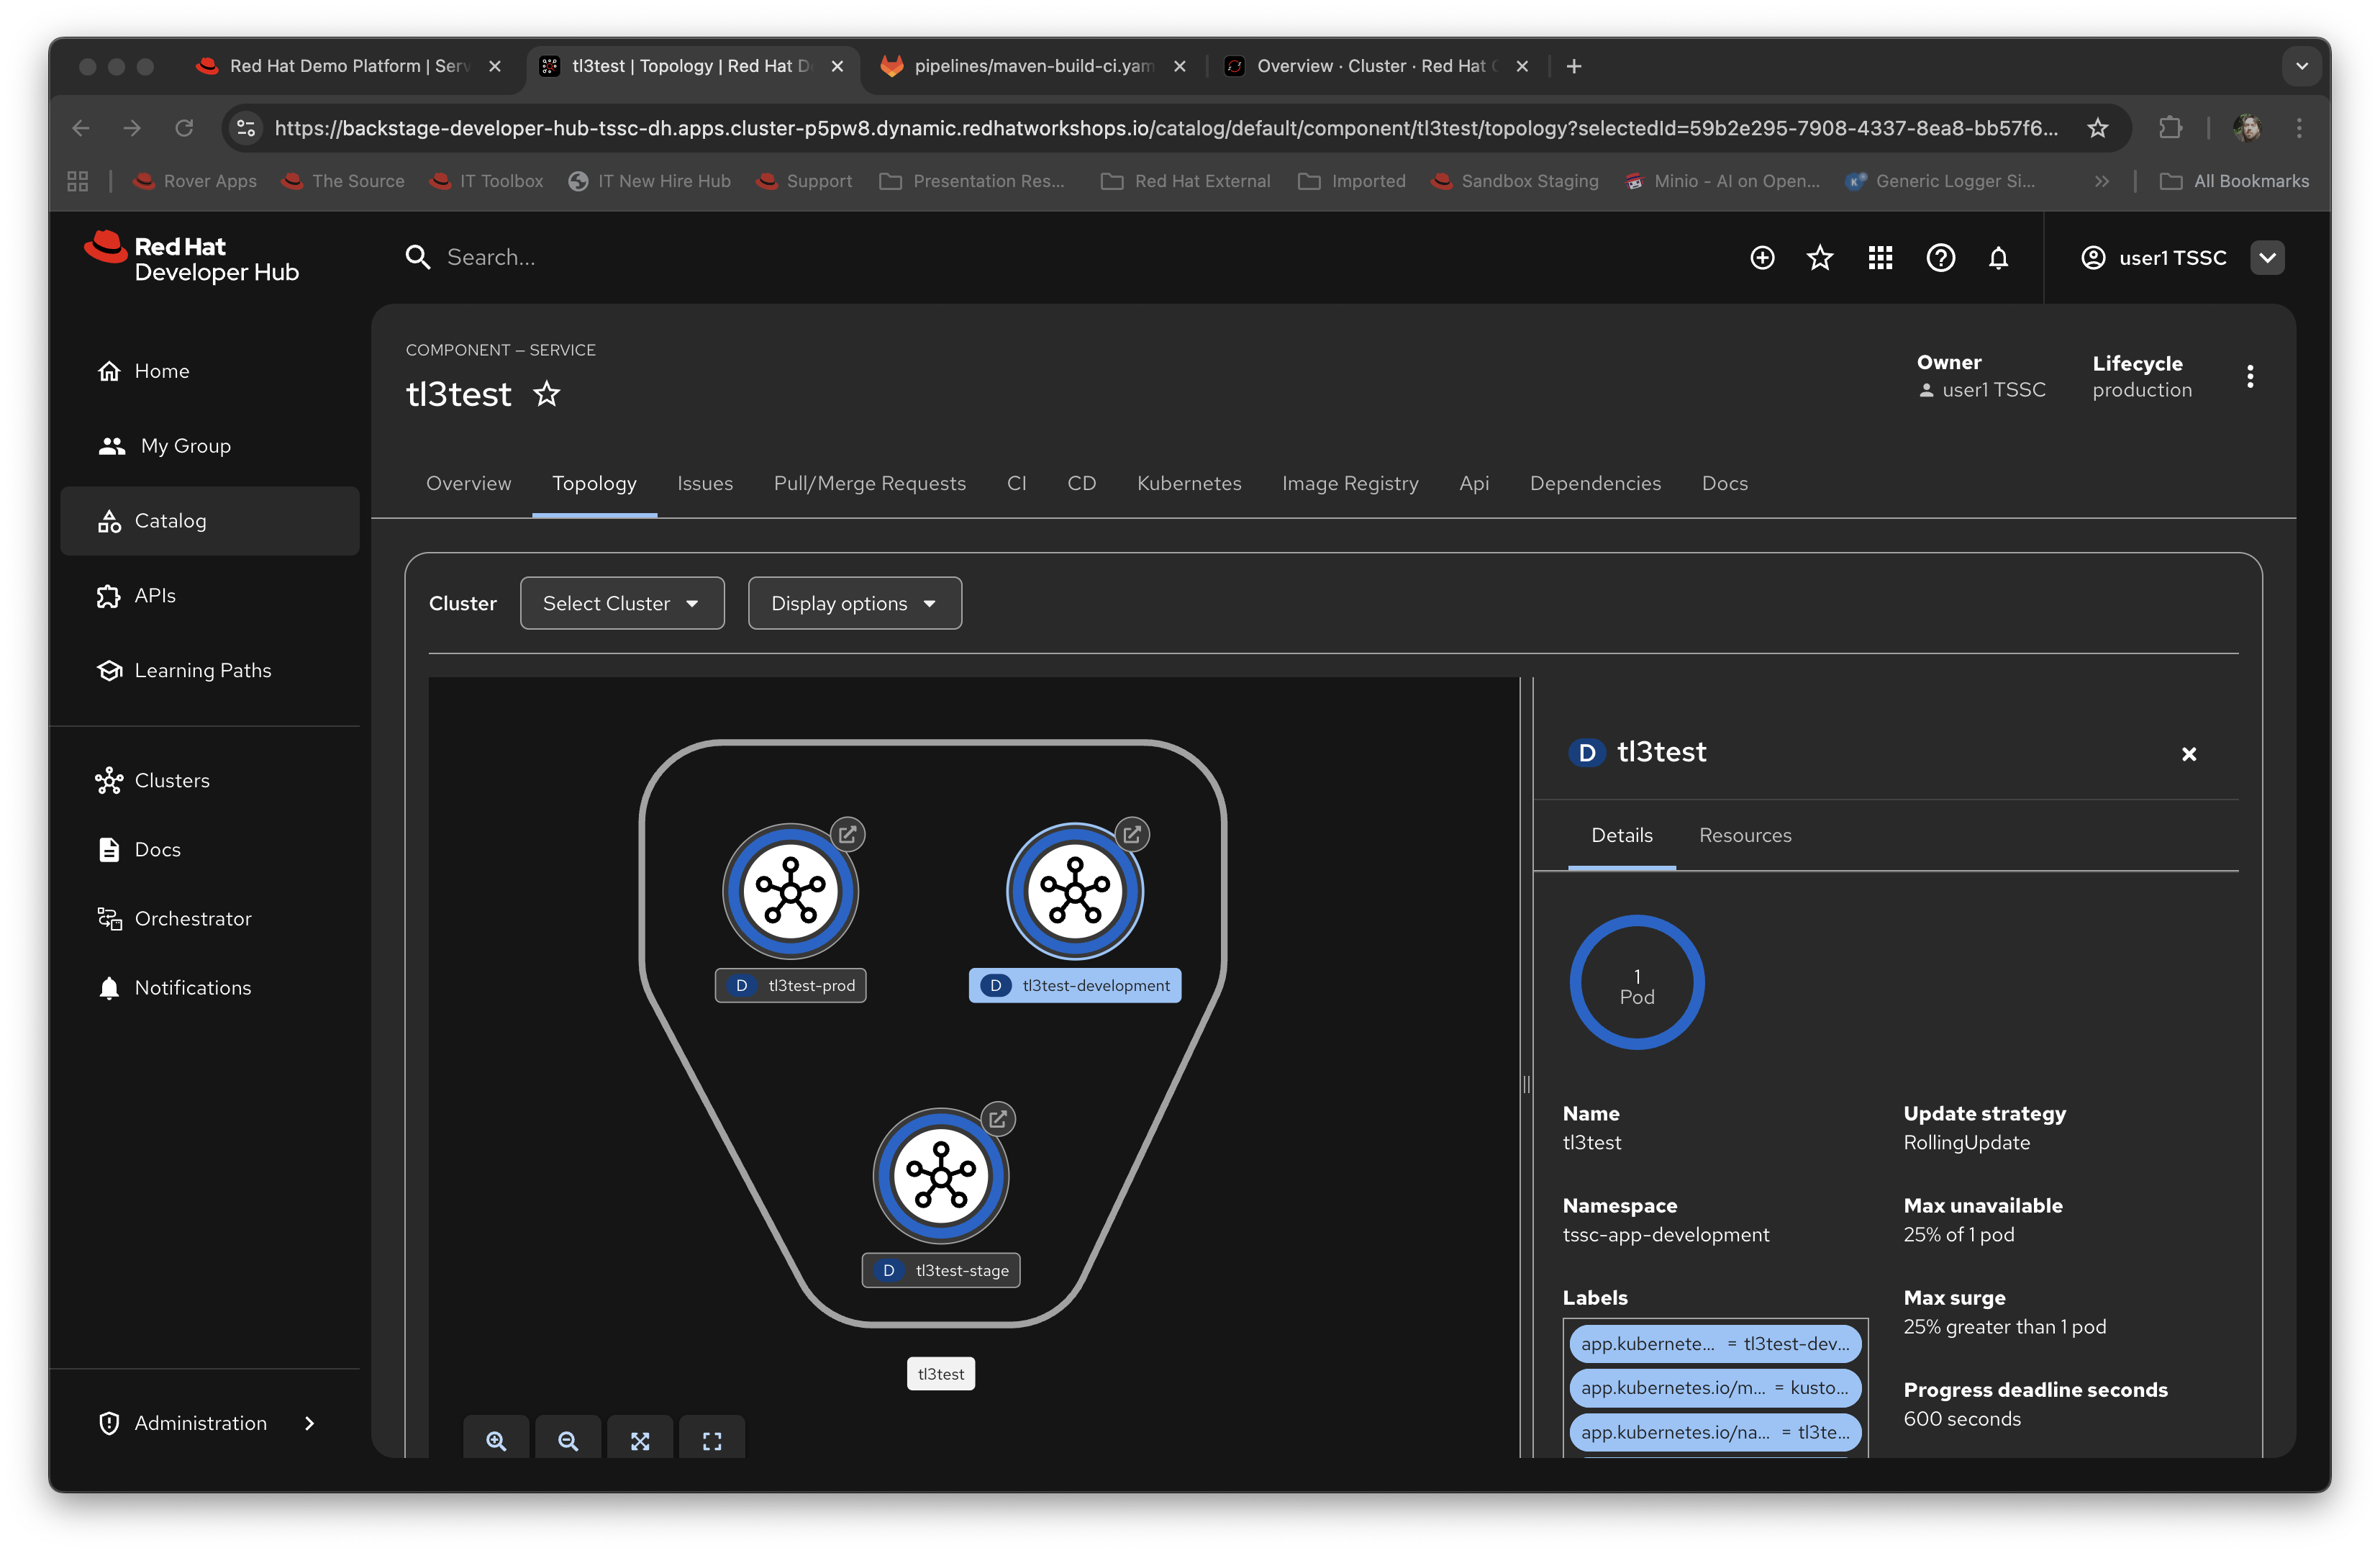
Note that it has deployed three versions of the Application: development, stage and production.
-
Now click on the CD tab (continuous deployment). This will show the state of the ArgoCD components that were scaffolded to deploy the application, and, interestingly, the pipeline components (the
*-cicomponents). Later on in the lab we will examine how to promote the software through the development, staging and production lifecycles simply and in an automated fashion.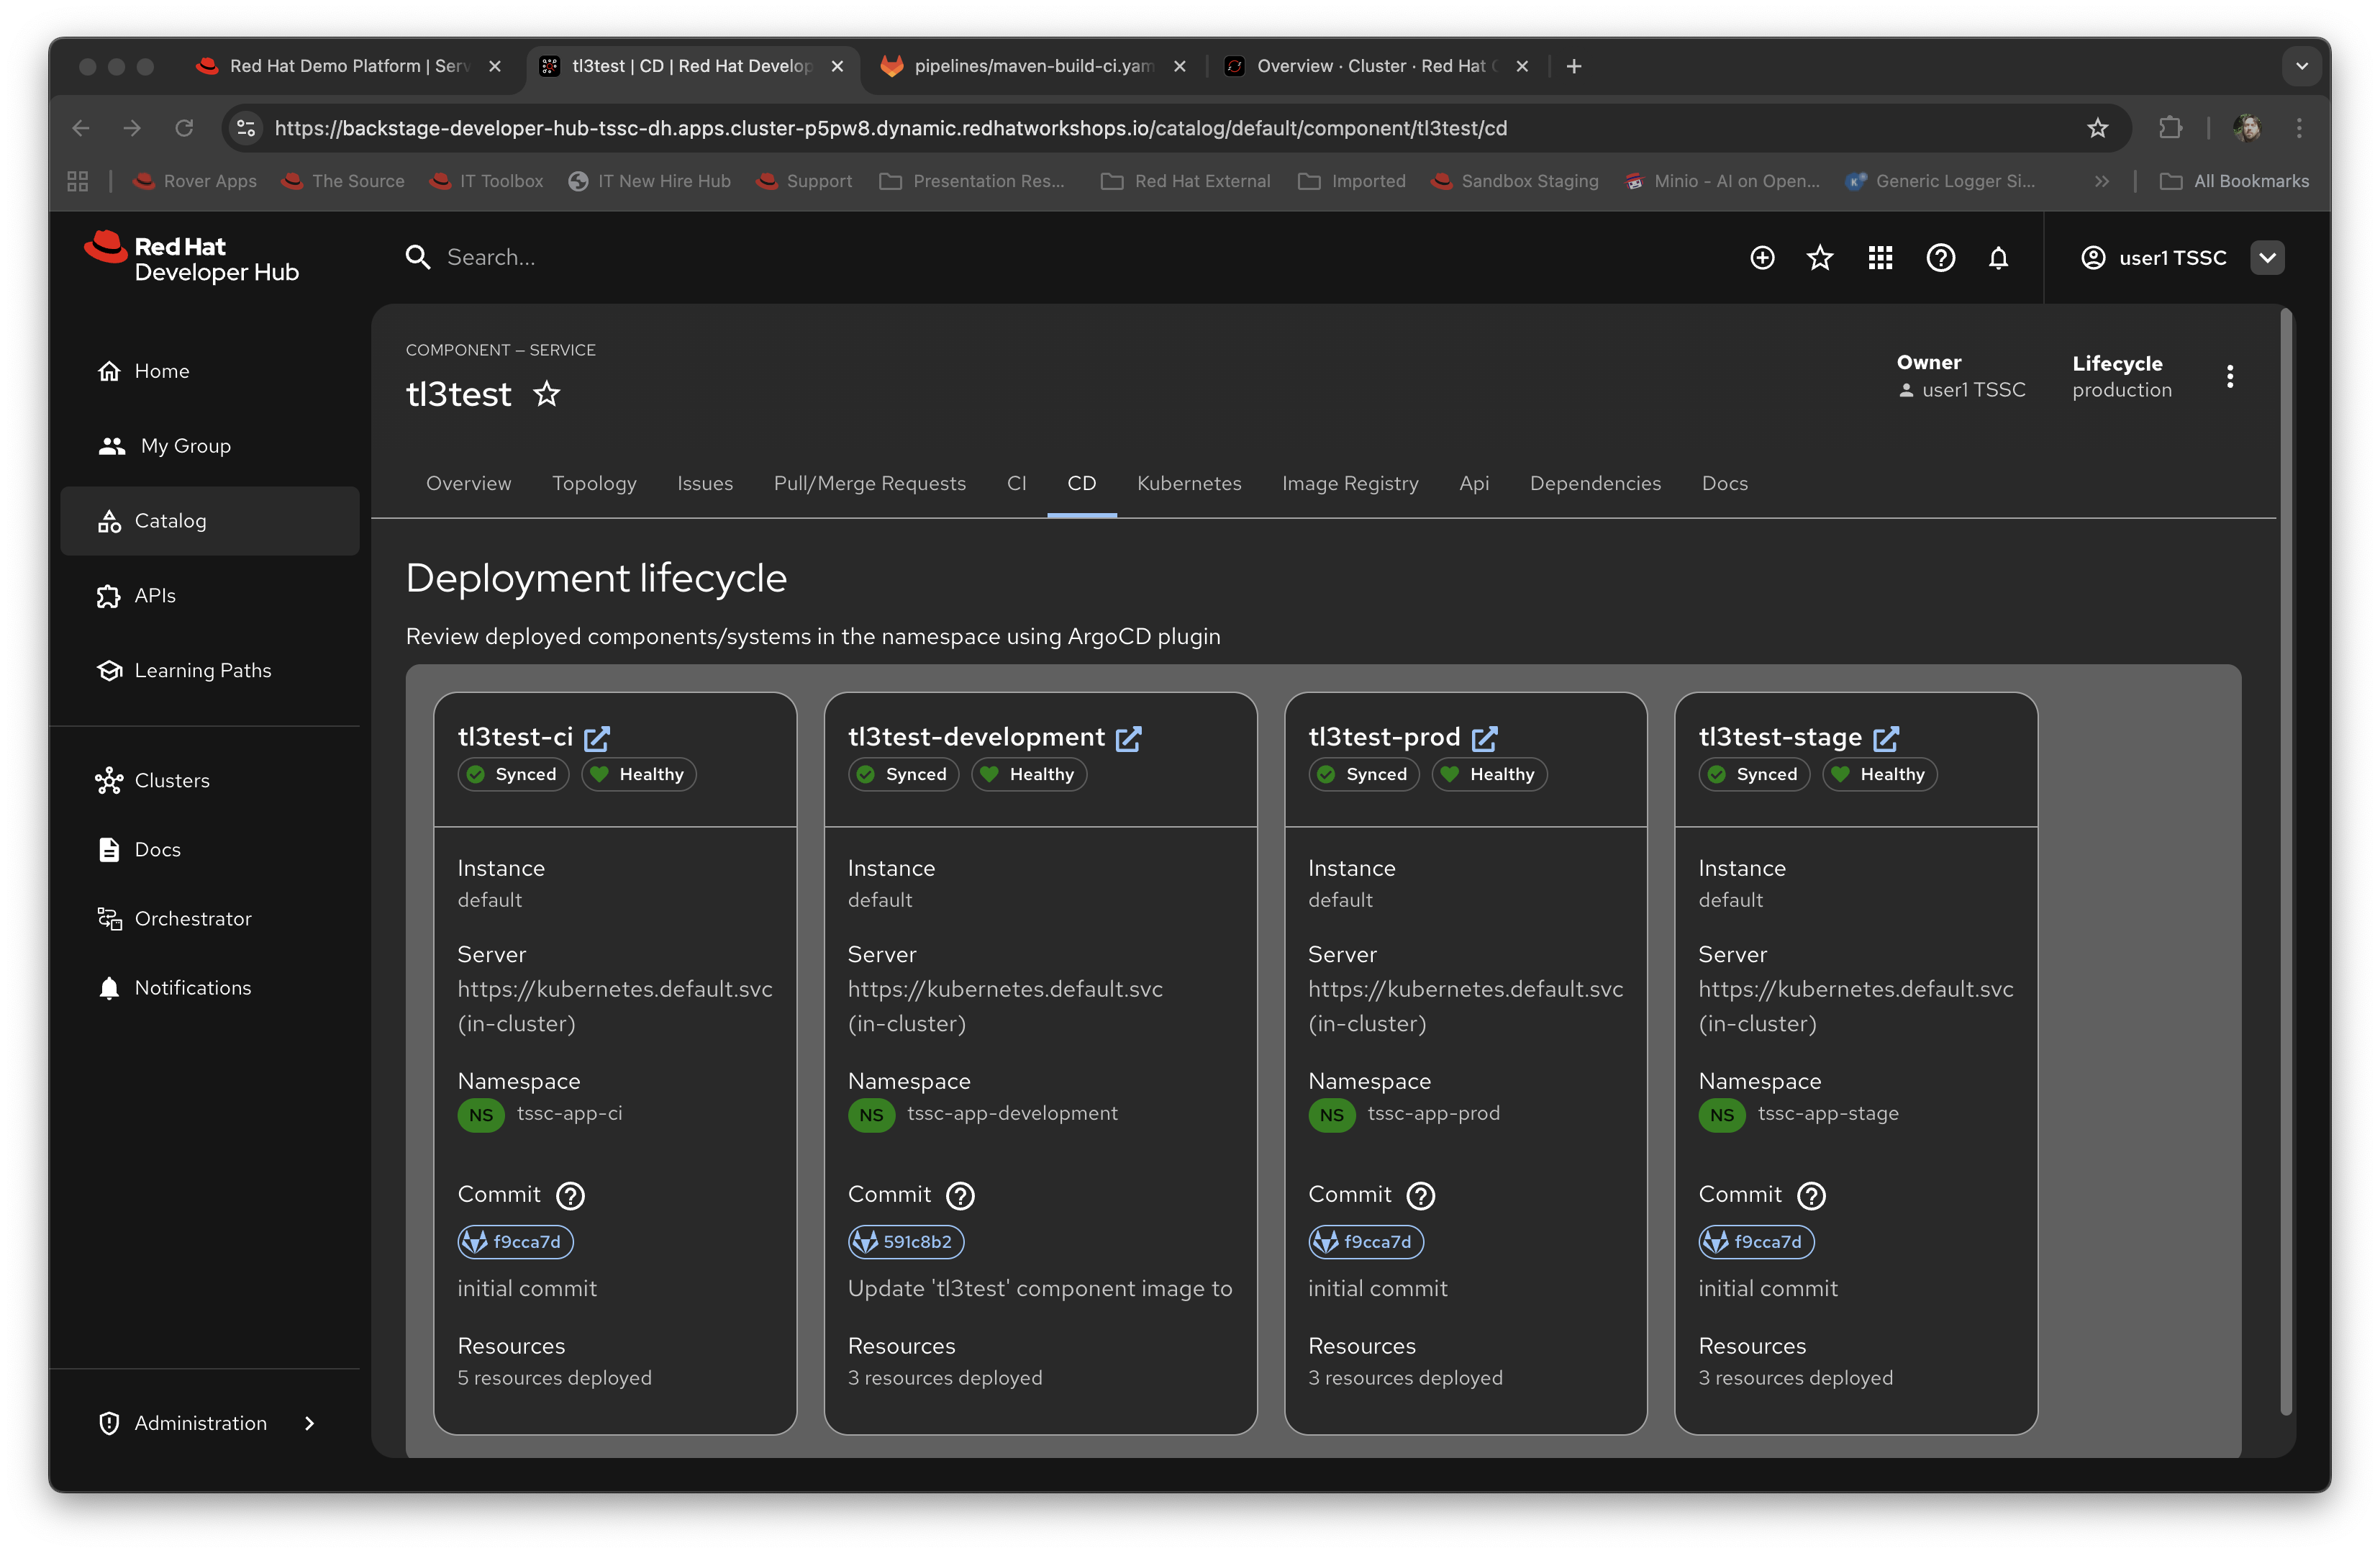
-
Switch back to the CI (continuous integration) tab; on the far right of the pipeline run are a set of icons, labelled view logs, view output and view SBOM. Click on the view SBOM icon; this will render the SBOM (Software Bill of Materials) created as part of this build, which is an immutable receipt for this individual build.
-
What we will do now is act as a developer; switch to the overview tab of the component, and click on the OpenShift Dev Spaces (VSCode) link.
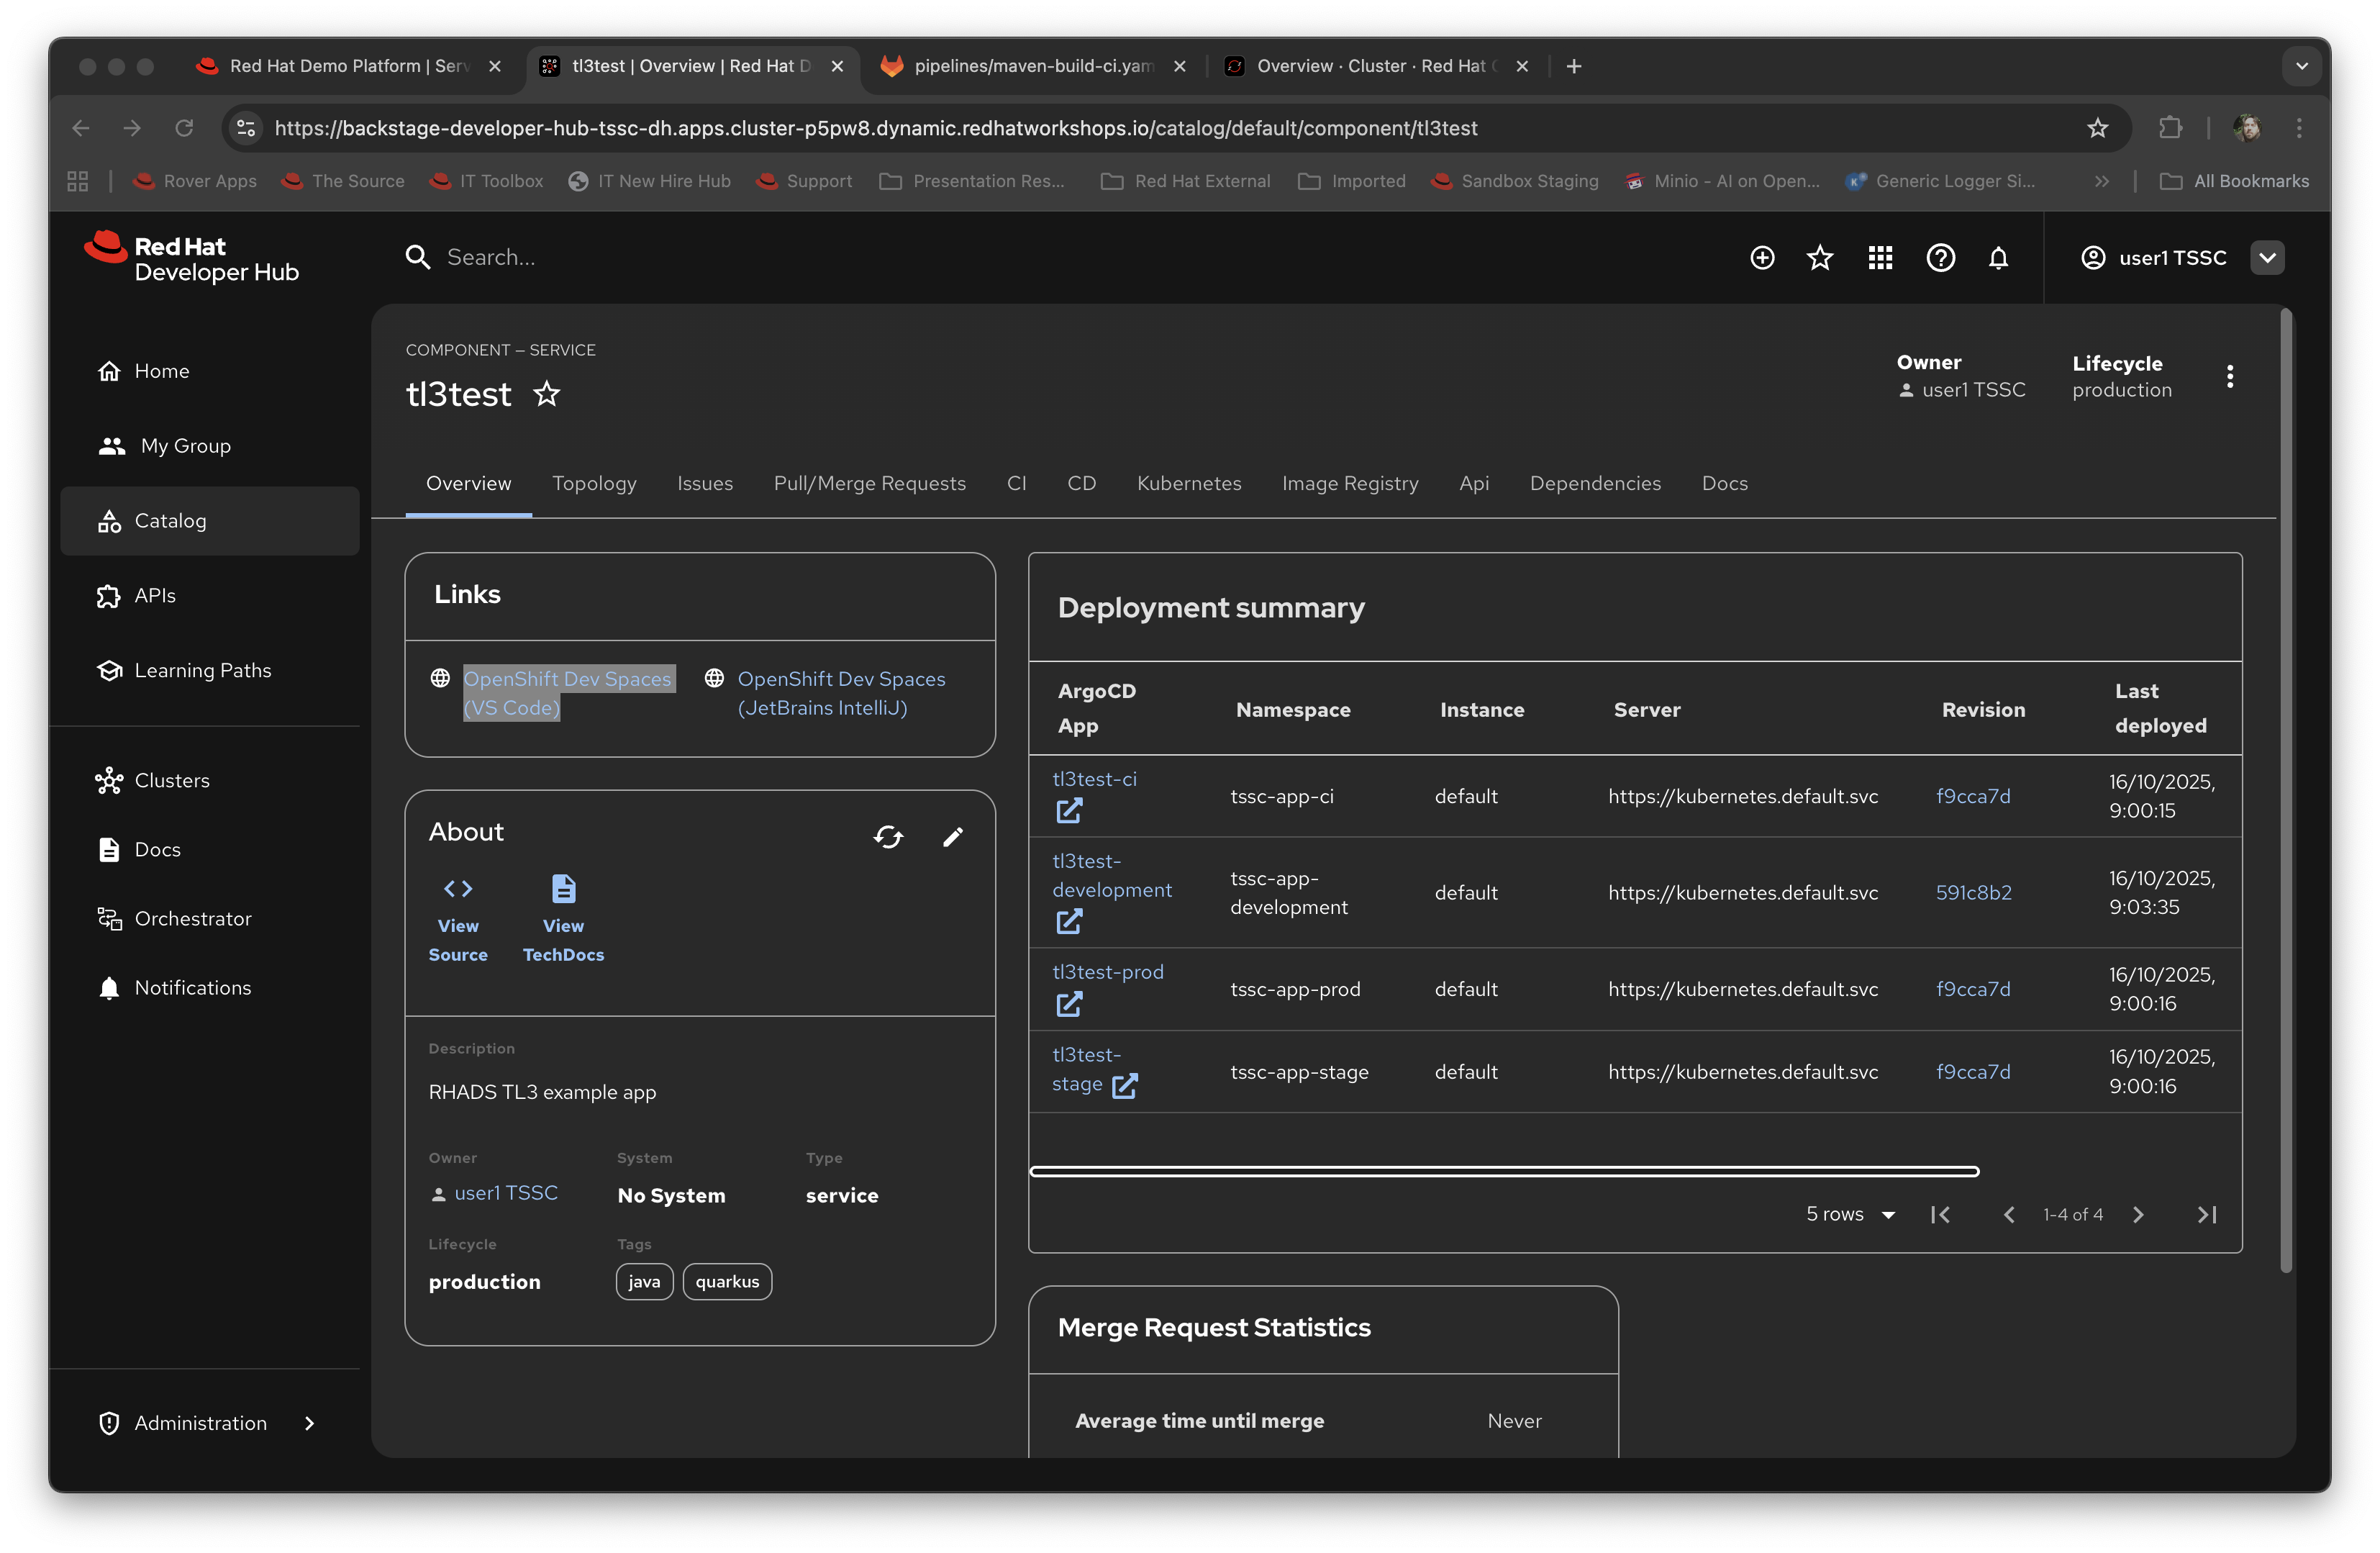
This link will open a browser tab with the OpenShift Dev Spaces component; this is an in-browser full IDE and when it starts up it will be pointing directly at the git repository created as part of the scaffolding.
It will ask if you trust the authors of the repository; click Continue.
The first time you go into Dev Spaces it will prompt you to allow access and also prompt for adding additional components; let it settle for a couple of minutes so all the components have been loaded correctly.
-
Before we trigger a new build, click on the Explorer icon on the far left if the code tree structure is not displayed yet. When the Workspace appears, click on the
pom.xmlfile.Dev Spaces works by maintaining a realtime copy of the files on the cluster, nothing is stored locally. In addition RHADS adds code monitoring components to the IDE; the
pom.xmlshould have a direct vulnerability. The code outline on the far right will contain red "squigglies" where the code has a potential issue. Scroll down so the lines are visible in the editor.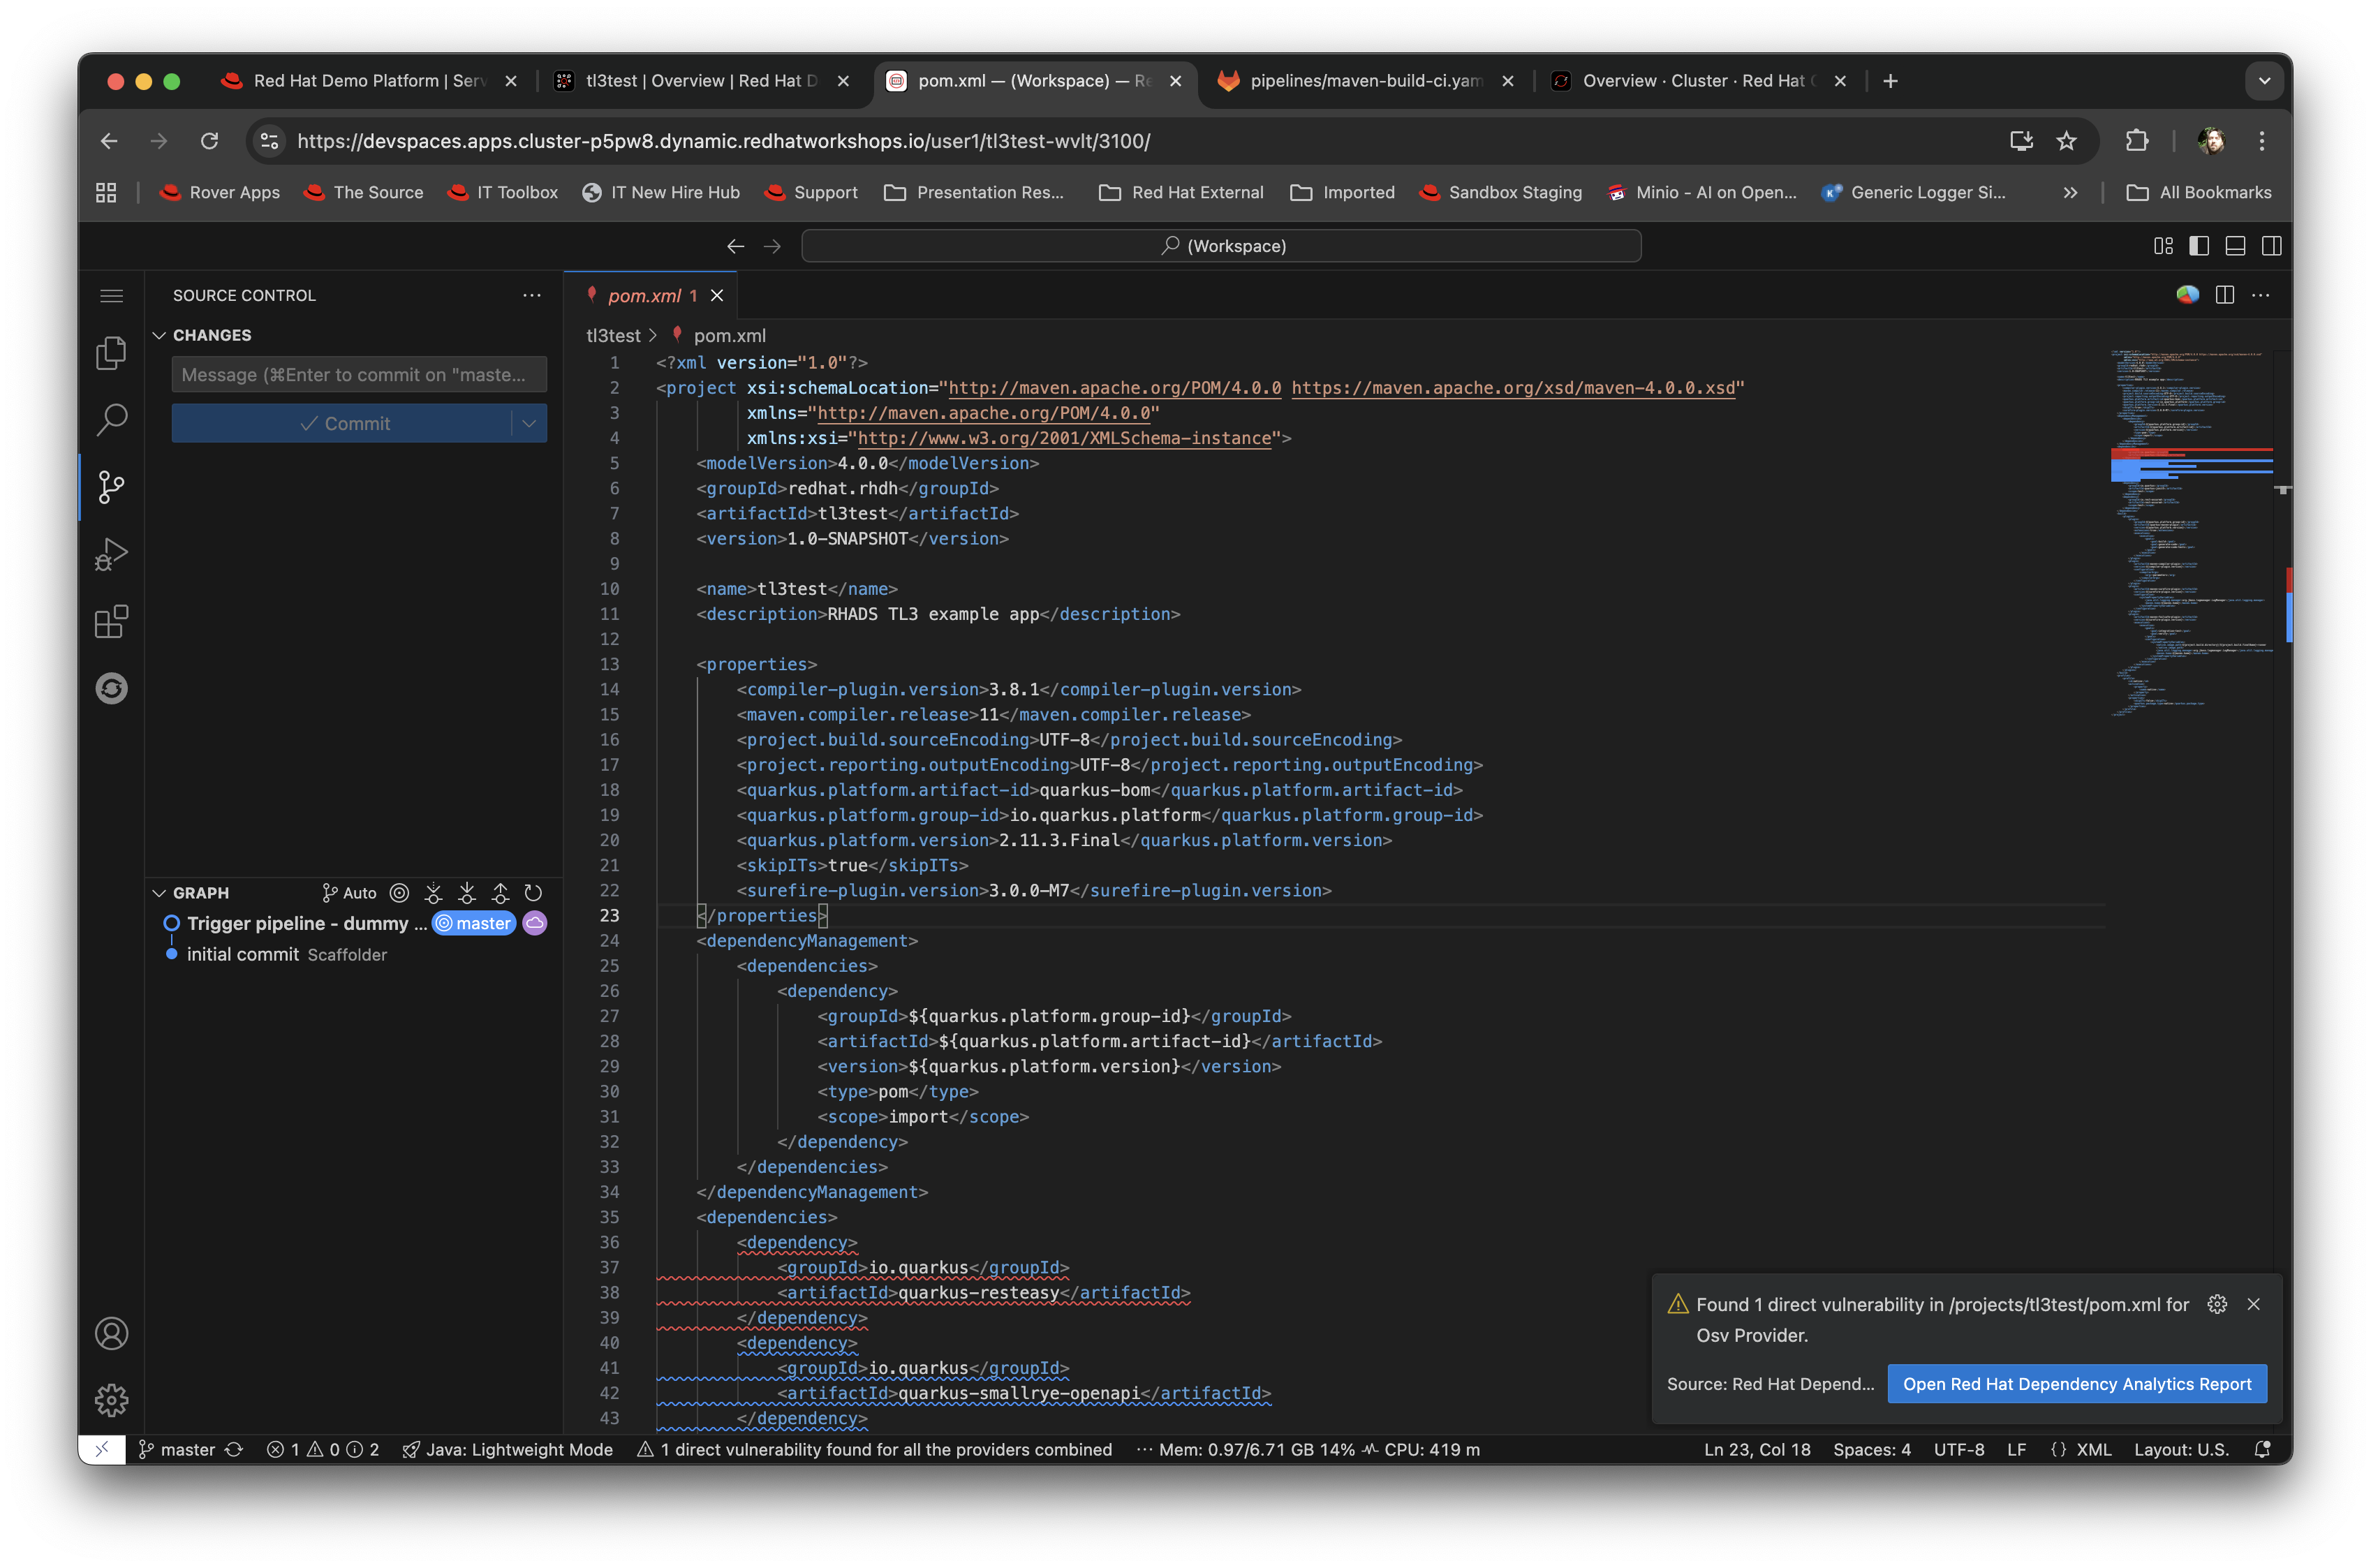
-
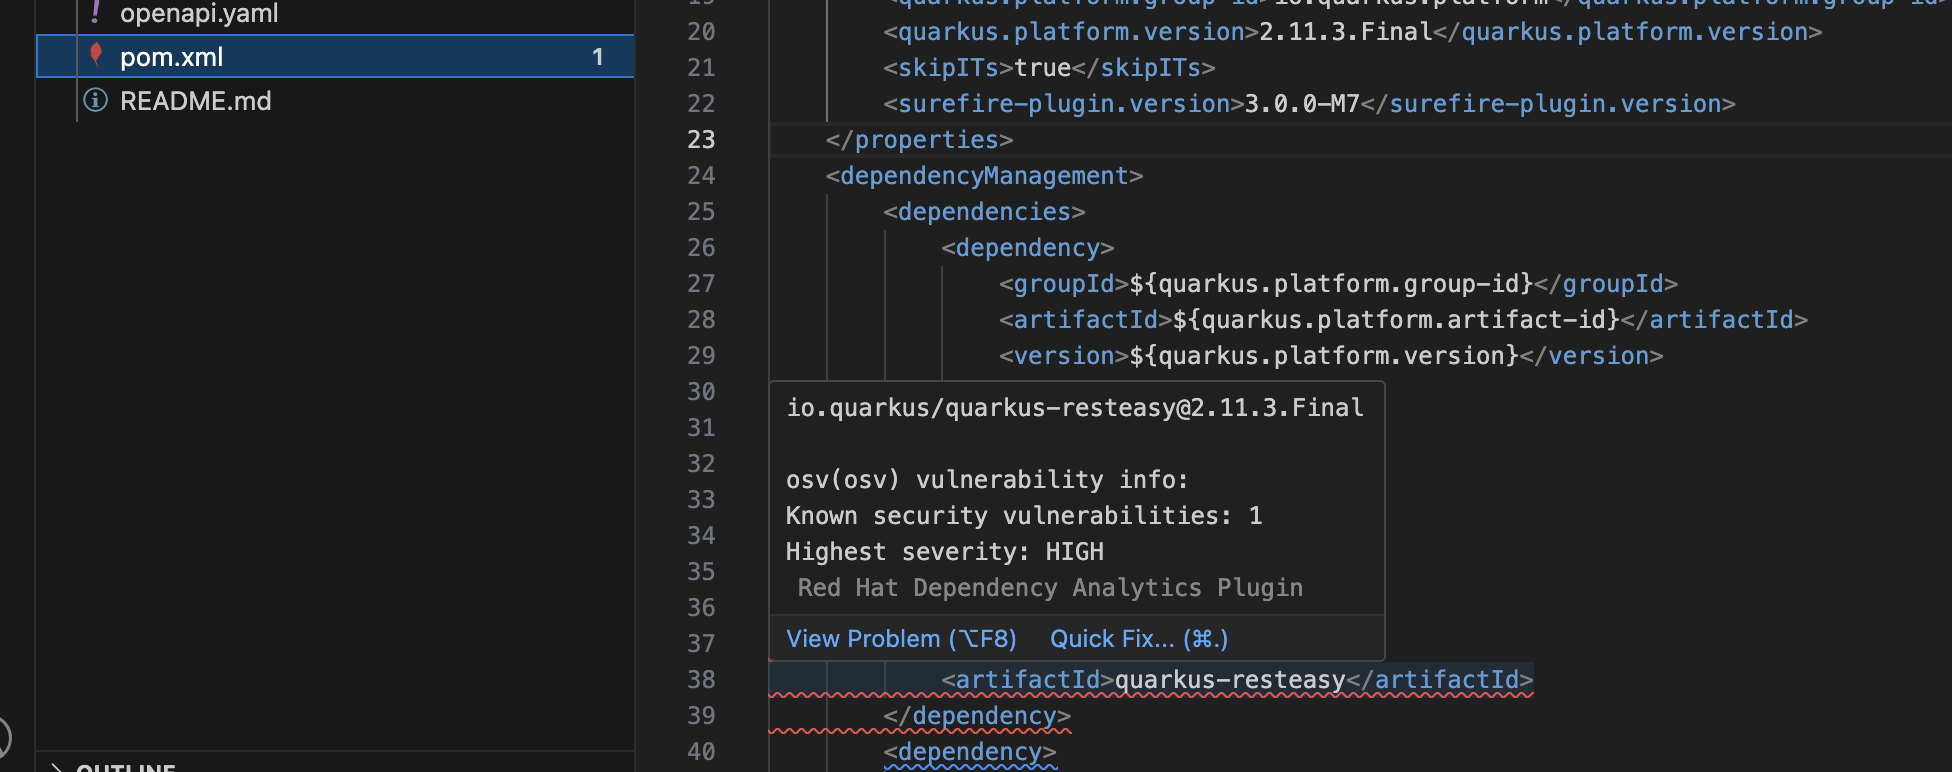
When the initial scan is done you will get a pop-up on the right bottom (shown in the preceding figure). If you hang the cursor over the red lines in the editor the information will pop up as shown below:
-
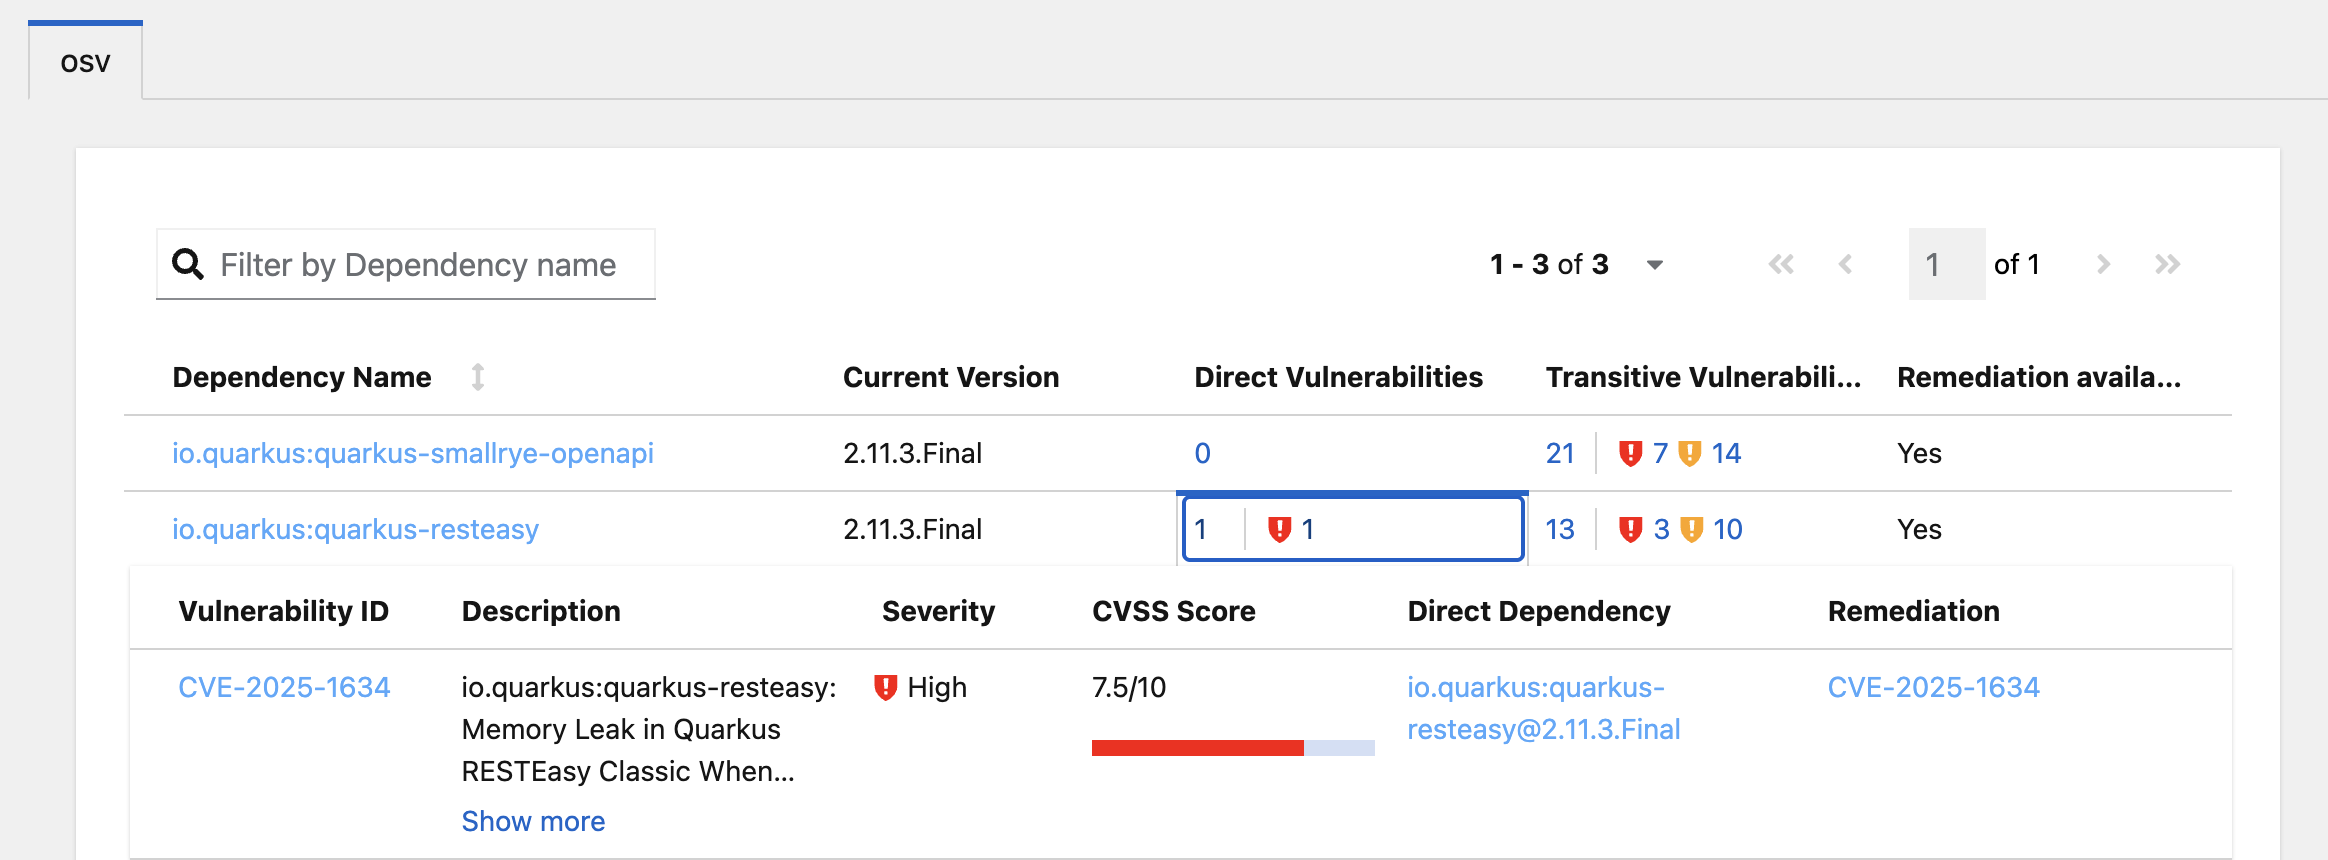
Click on 'Quick Fix' and the dependency report will appear within Dev Spaces. In the report you can scroll down to the vulnerabilities and check the remediation information:
Change some code and trigger a new build
Now we will act as a developer and change some code.
-
Click on the
README.mdfile on the left-hand navigation. -
Where it shows the description you entered earlier in the template wizard, add a line of text (anything you want). Dev Spaces will save the changes and indicate that there are differences in your local files to the repository (which was created and scaffolded by the template).
-
On the far left navigation icons, click on the Git icon - it will have a blue circle with a number in it, probably 1, indicating changes made to the files. In the message box type
Changed README.mdand then click Commit. It will ask you to stage the changes - select Yes. -
The Commit button will change to Sync Changes. This will push the code changes to the git repo created by the template and, using the webhooks also instantiated by the template, start the secure build pipeline again. Click it now.
-
Switch back to Red Hat Developer Hub, go to the Catalog, click on the component you just created and switch to the CI tab; you will see the pipeline has restarted (due to the commit of code).
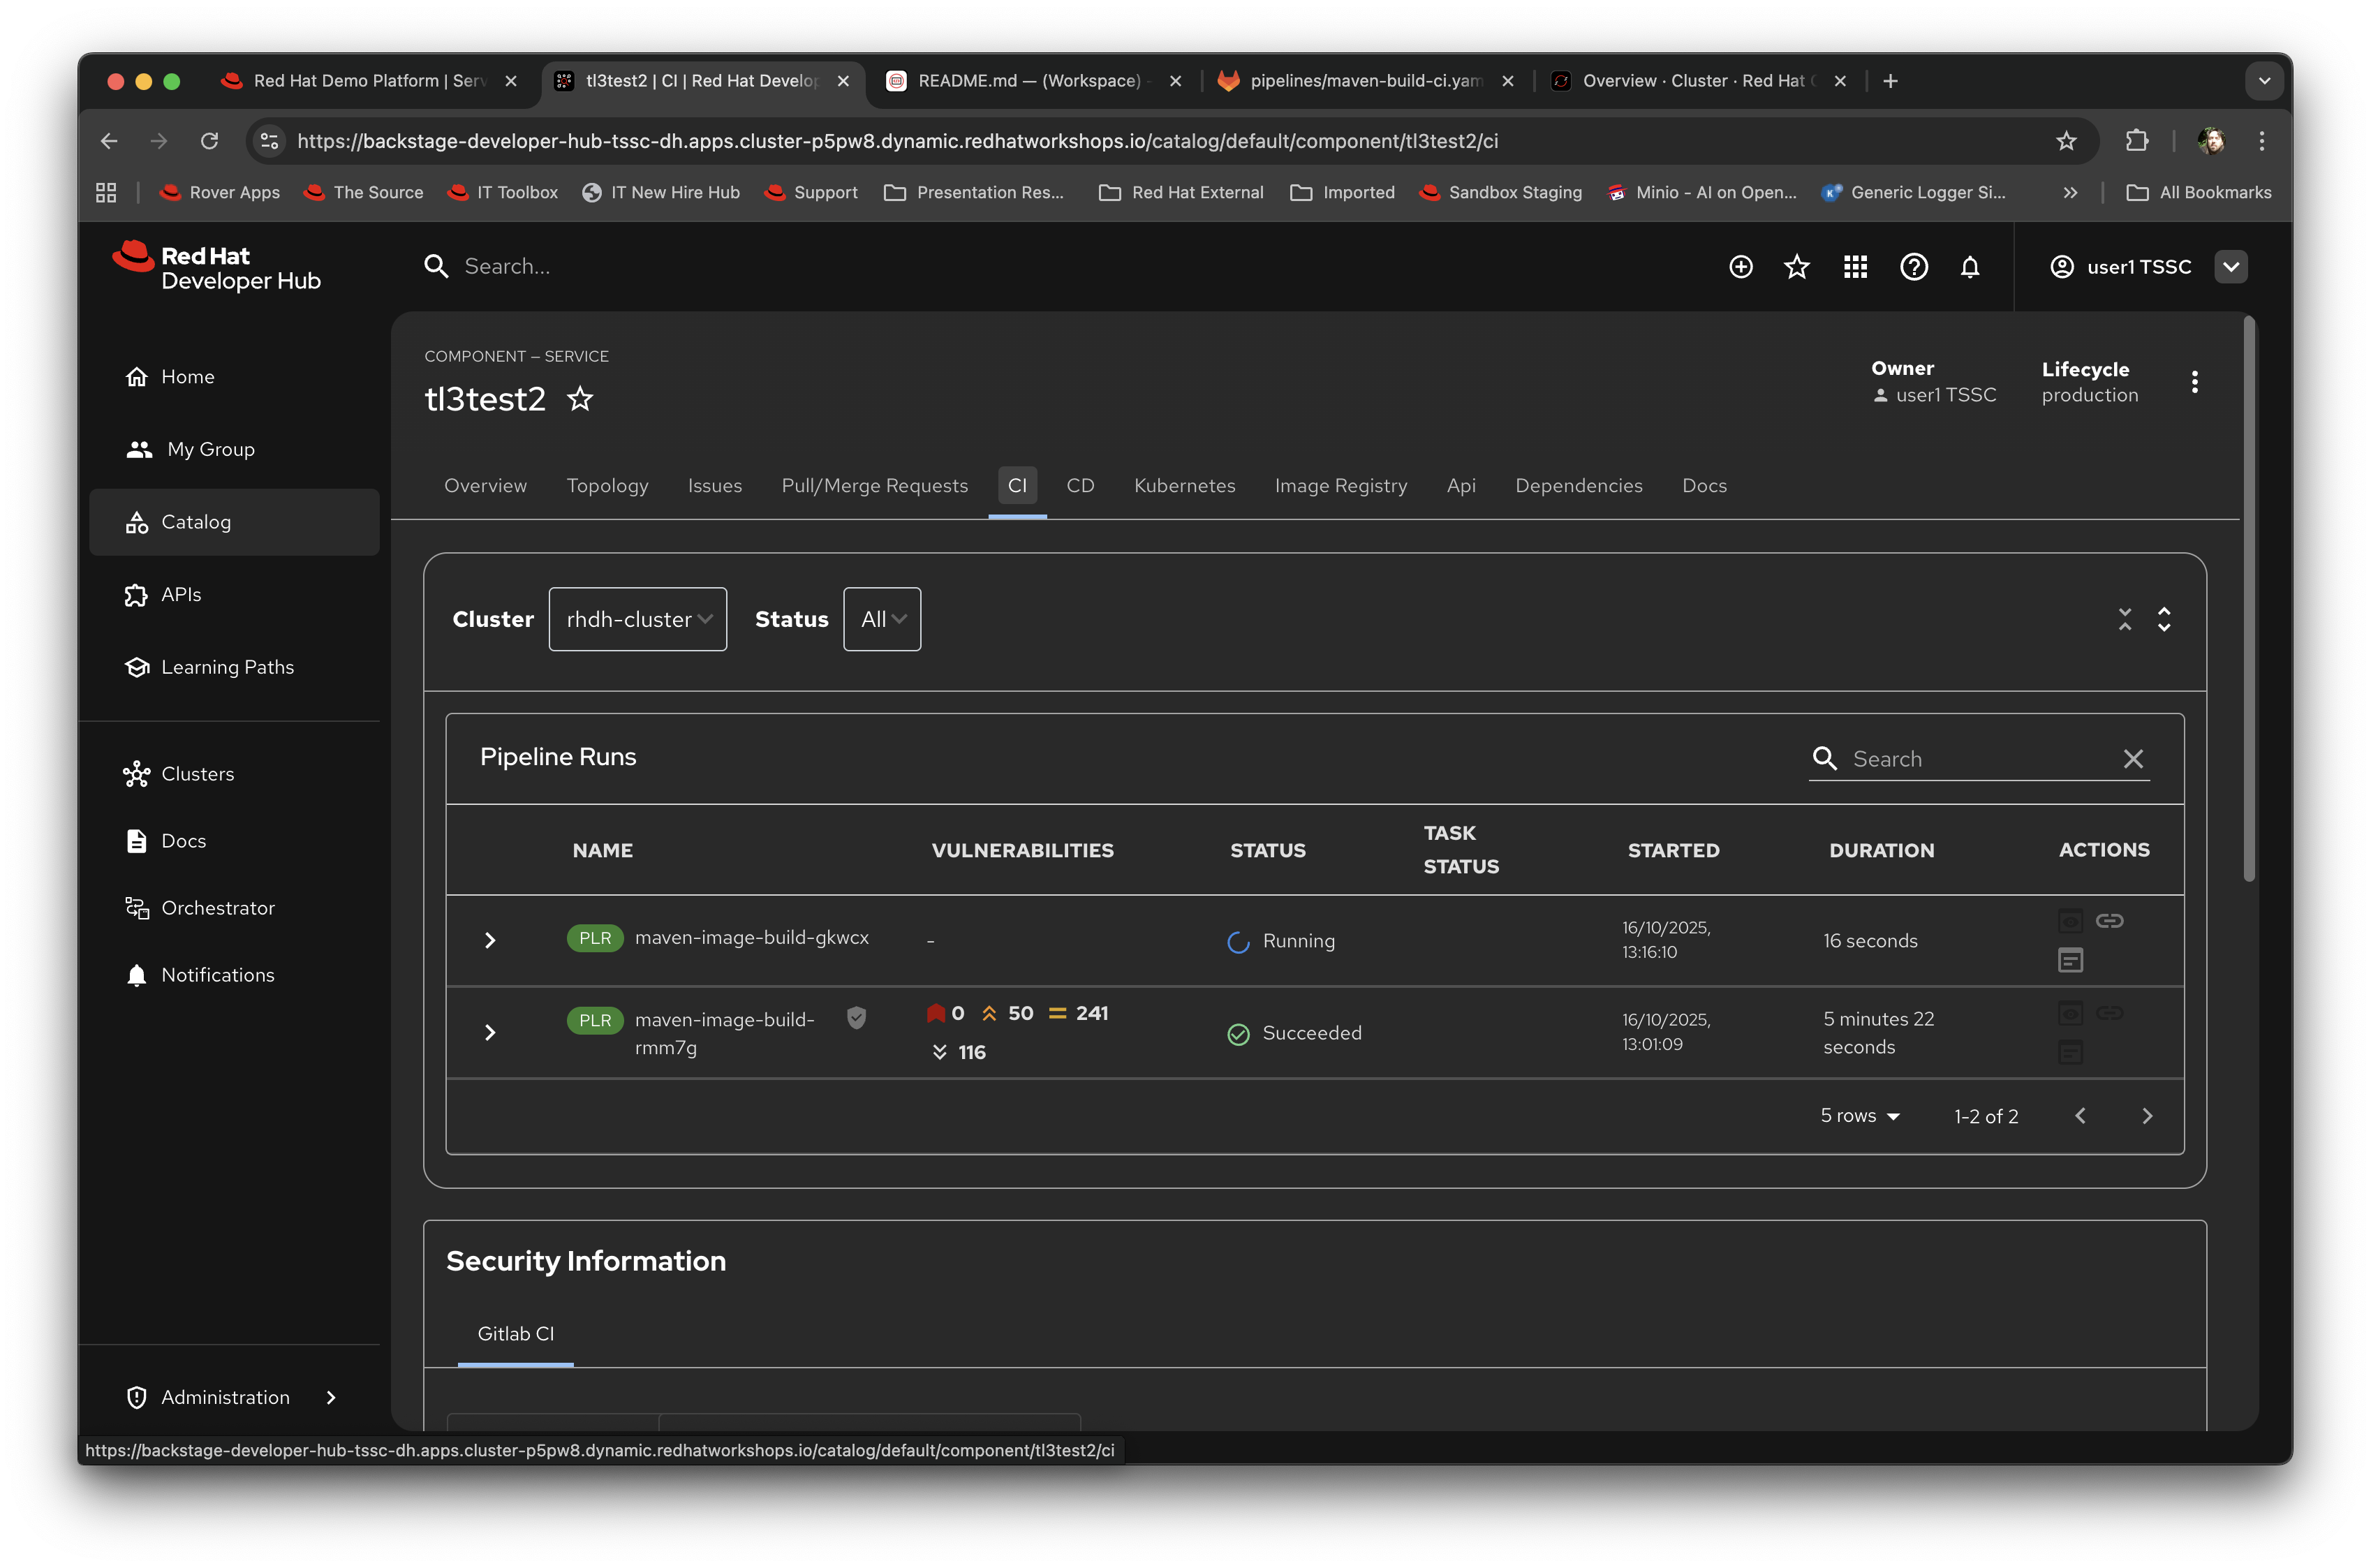
This is the end result of the process (a webhook trigger) that links the developer’s committing code (end product) to the automatic start of the secure build.
Advanced - Modifying the base secure Pipelines
As mentioned earlier, a customer can add (or remove) components of the base secure pipelines depending on their organization’s needs. What we have seen so far is a standard developer interaction with the product. In this section we will show you where and how to alter the flow of the base pipelines to add customer/organization additional steps in.
Remember that by using the Red Hat Developer Hub template, it creates all the code and components needed for the end-to-end developer/ops functionality. As part of that, the base pipelines that back the TSSC templates are installed as well.
-
Navigate to the {gitlab_url}[GitLab URL^]. And login:
-
Username:
{gitlab_user} -
Password:
{gitlab_user_password}At the high level project view, there will be a number of repos; these are either in the development group or in the rhdh group.
-
-
Find the
rhdh/tssc-sample-pipelinesrepository, as shown in the image below: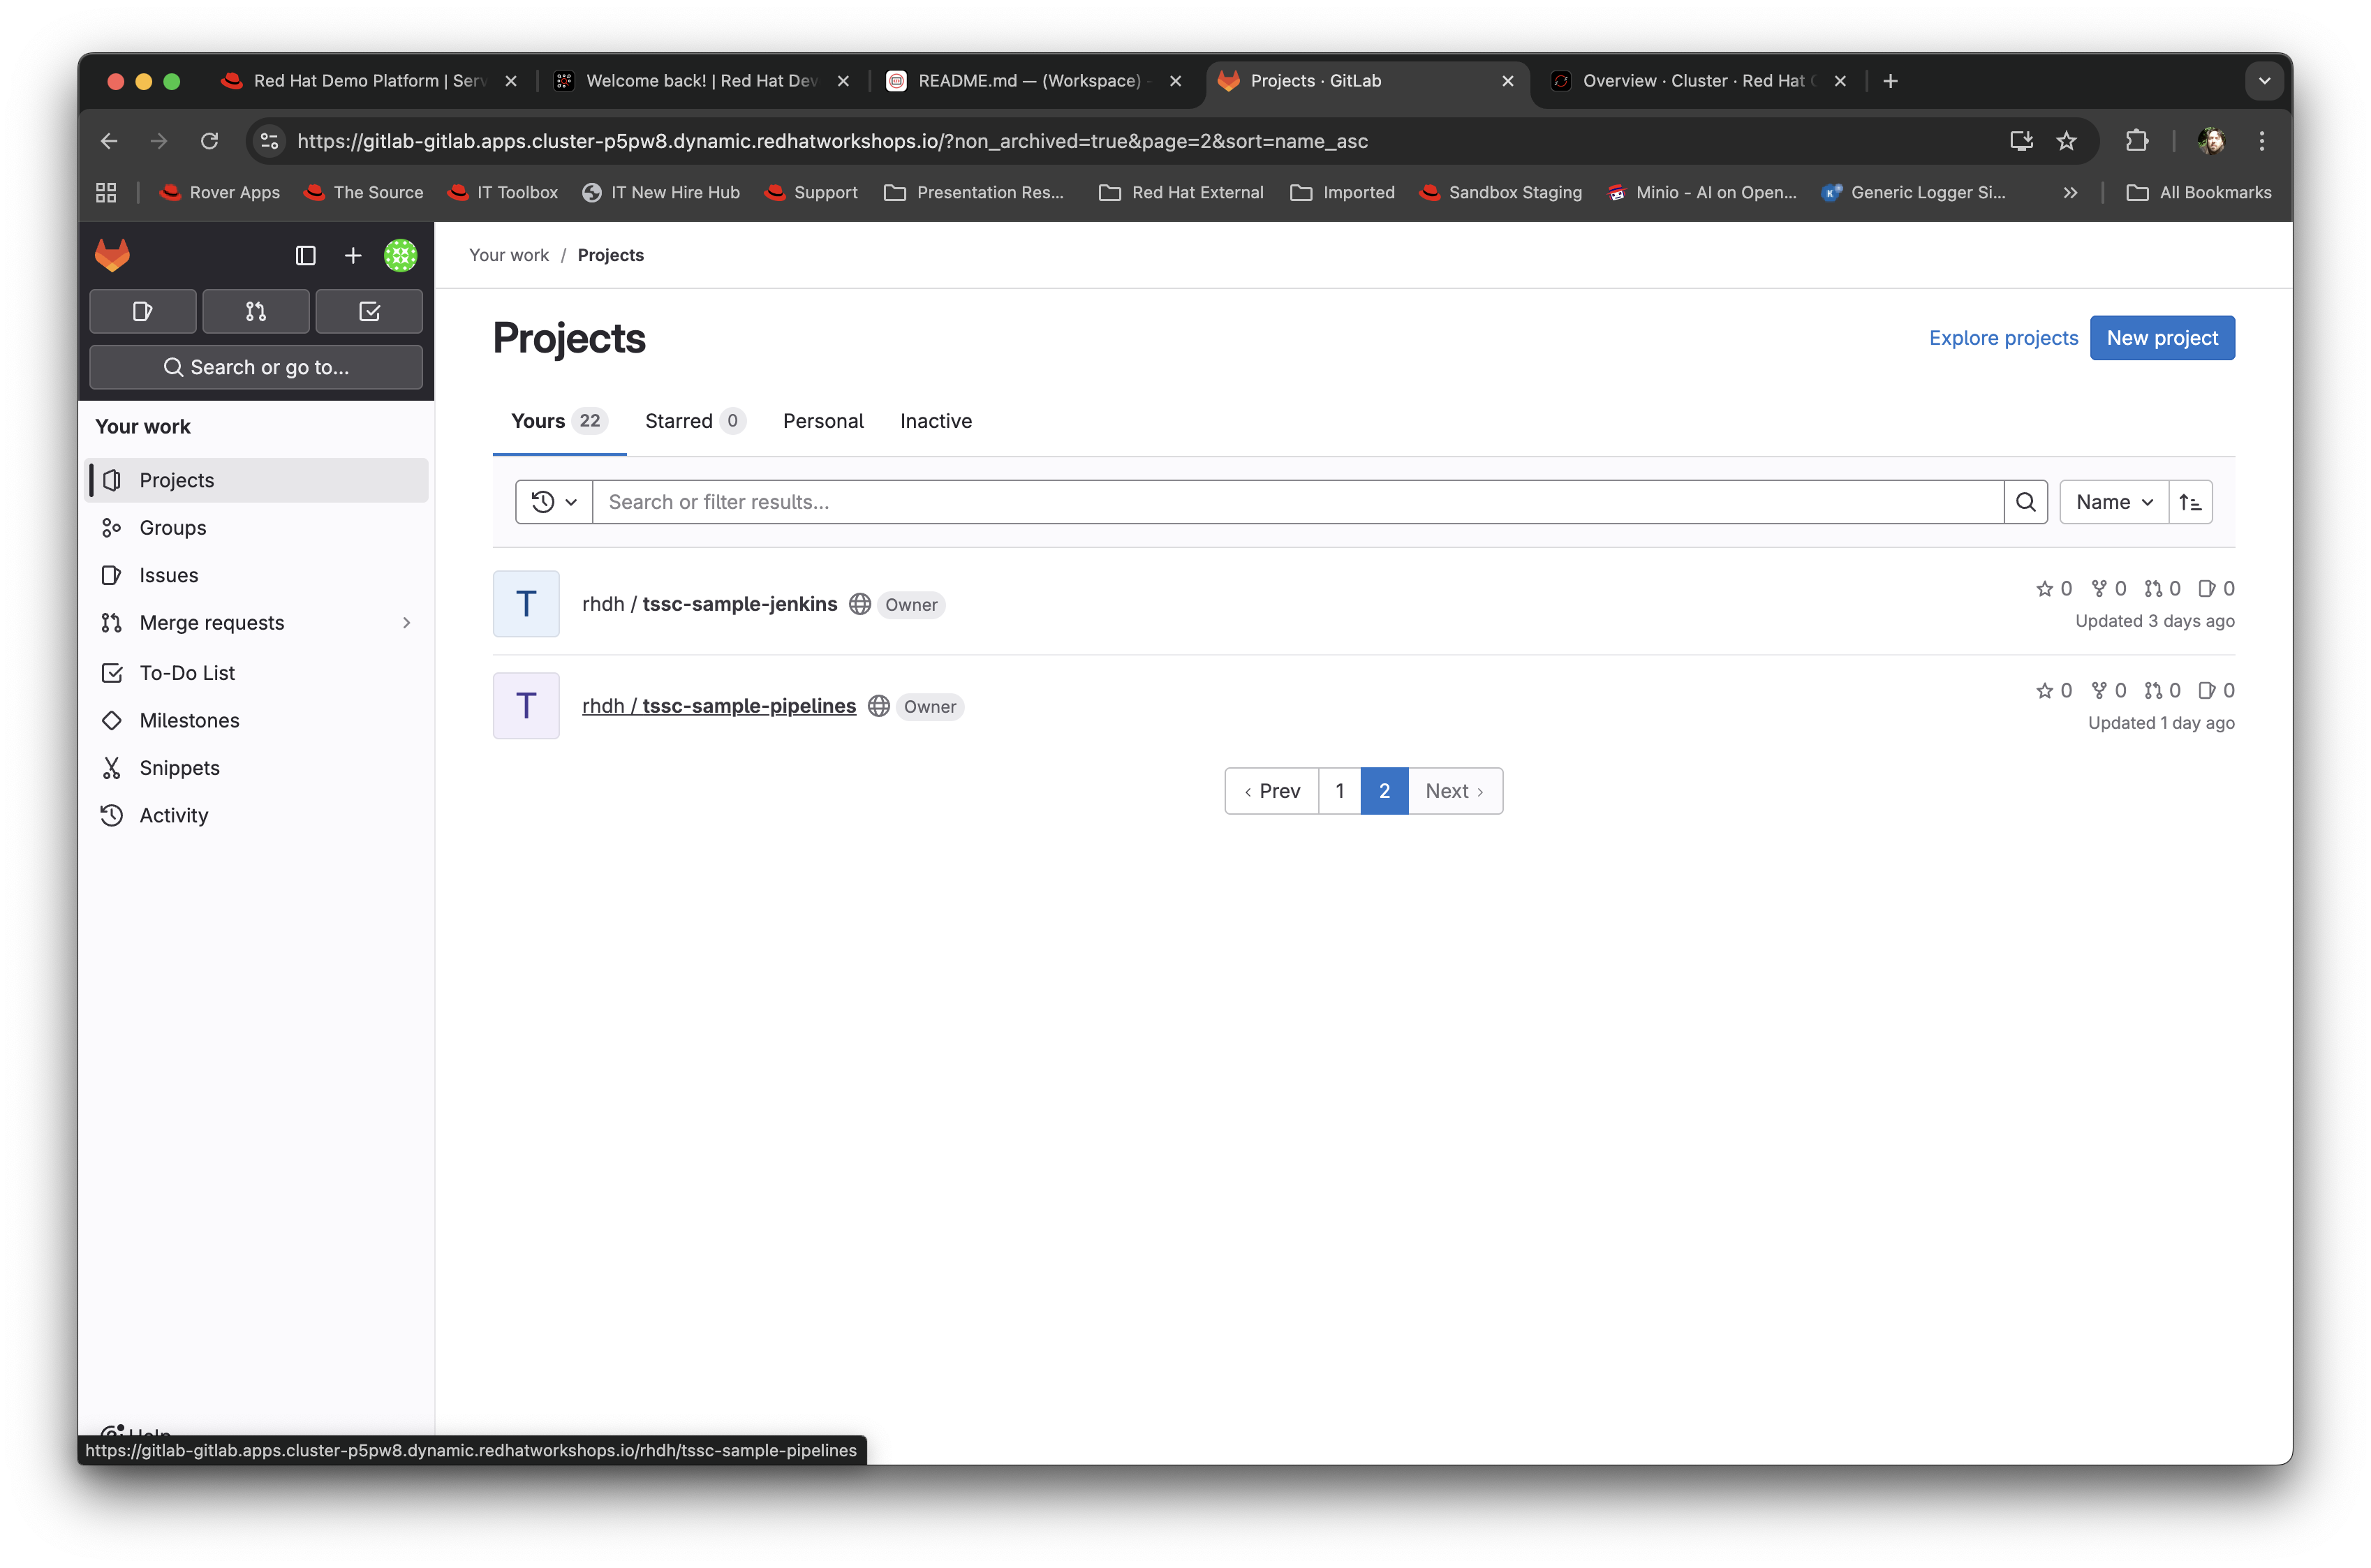
-
Click on the
tssc-sample-pipelinesrepo, and then click on thepipelinessubfolder when it appears. There should be two sample pipelines in this folder; click on themaven-build-ci.yamlone. -
In the content page for this one, including the source, click on the Edit dropdown and select Edit Single File - we are going to add a separate step to the trusted pipeline that is executed as part of any template that instantiates this.
-
Scroll down to where the tasks are defined. We are going to add a new task named
octestafter theinittask, as follows:tasks: - name: init params: - name: image-url value: $(params.output-image) - name: rebuild value: $(params.rebuild) taskRef: name: init ## Add this task after the above init task: - name: octest taskRef: resolver: hub params: - name: kind value: task - name: name value: openshift-client - name: version value: '0.2' params: - name: SCRIPT value: oc whoami - name: VERSION value: '4.18' runAfter: - init ## End of the new task - name: clone-repositoryYou are adding the
octesttask, theinitandclone-repositoryalready exist, copy the code for theoctesttask into the file and ensure the indentation matches the other existing tasks!What we are doing is adding a simple task that echoes the OpenShift user context; it runs after the init task. The task itself is trivial, but this will show how easy it is to add a task to the base secure pipelines.
-
When you have changed the code, scroll down and click Commit Changes.
-
Now switch back to your Dev Spaces tab. If you have closed it, go to Red Hat Developer Hub, select your component from the catalog, and click the OpenShift Dev Spaces link in the overview.
-
In the Dev Spaces tab, select the
README.mdfile again, and add another line of text below the top header (where you entered text before to trigger the pipeline). -
As before, commit this change using the gitops icon on the far left, providing a Commit message and then syncing the changes.
-
Switch back to the Red Hat Developer Hub tab, select your component from the catalog, and look at the CI tab you will see another pipeline has started. Let it complete, then expand the pipeline run. The new task,
octest, will appear as part of the process as shown below: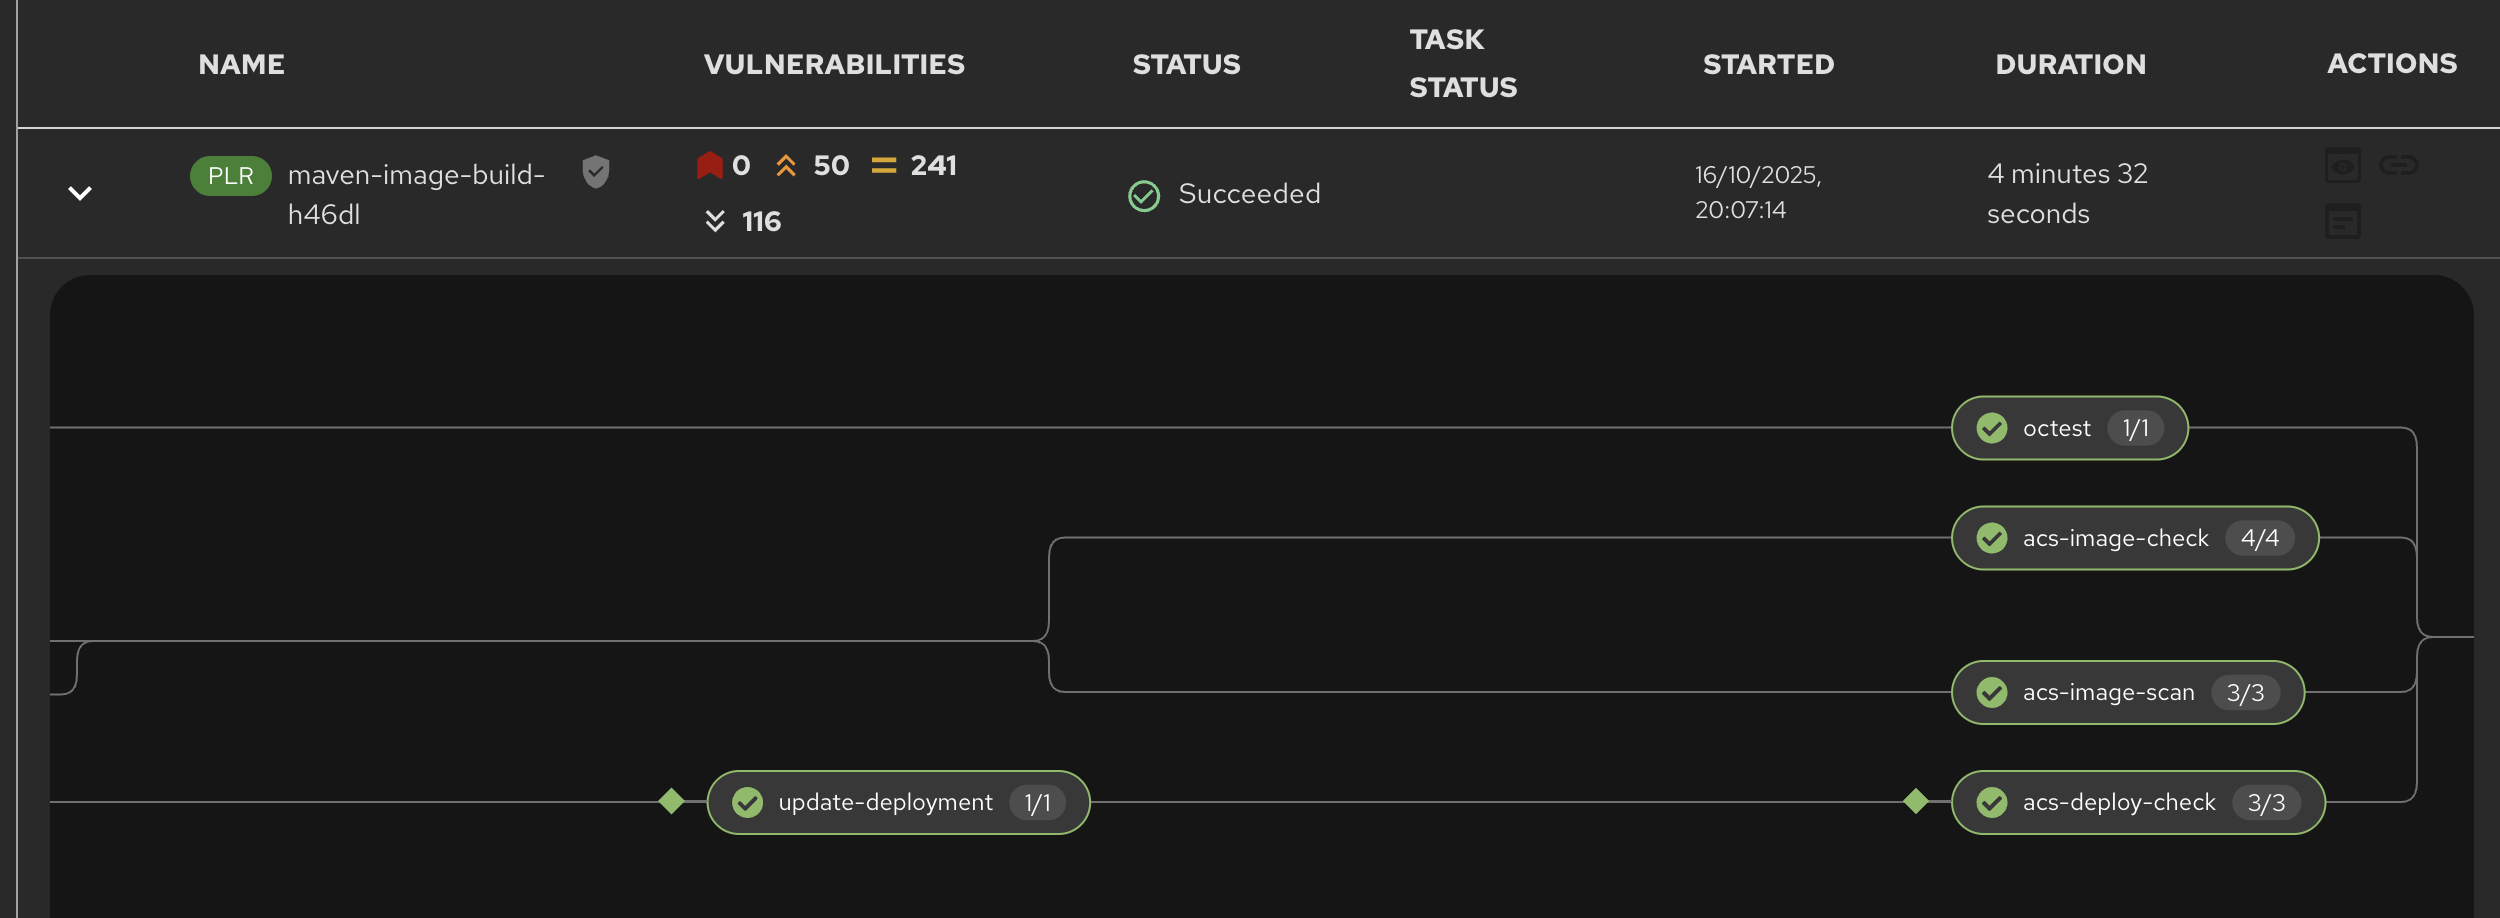
This is how a customer may add additional tasks into the appropriate pipeline.
Promoting the code releases through development, staging and production
The TSSC sample pipelines included in RHADS also adds the ability to promote code releases from development to staging and then to production, as part of an automated process. If you remember when we looked at the topology, the default deployment for the TSSC template produces three applications: development, staging and production. Staging is triggered by tagging the code repository post-development.
-
To do this, go to {rhdh_url}[Red Hat Developer Hub^], select your component from the catalog, and then click on the
<> View Sourceicon in the About section on the Overview tab. This will take you directly to the scaffolded code repository in GitLab.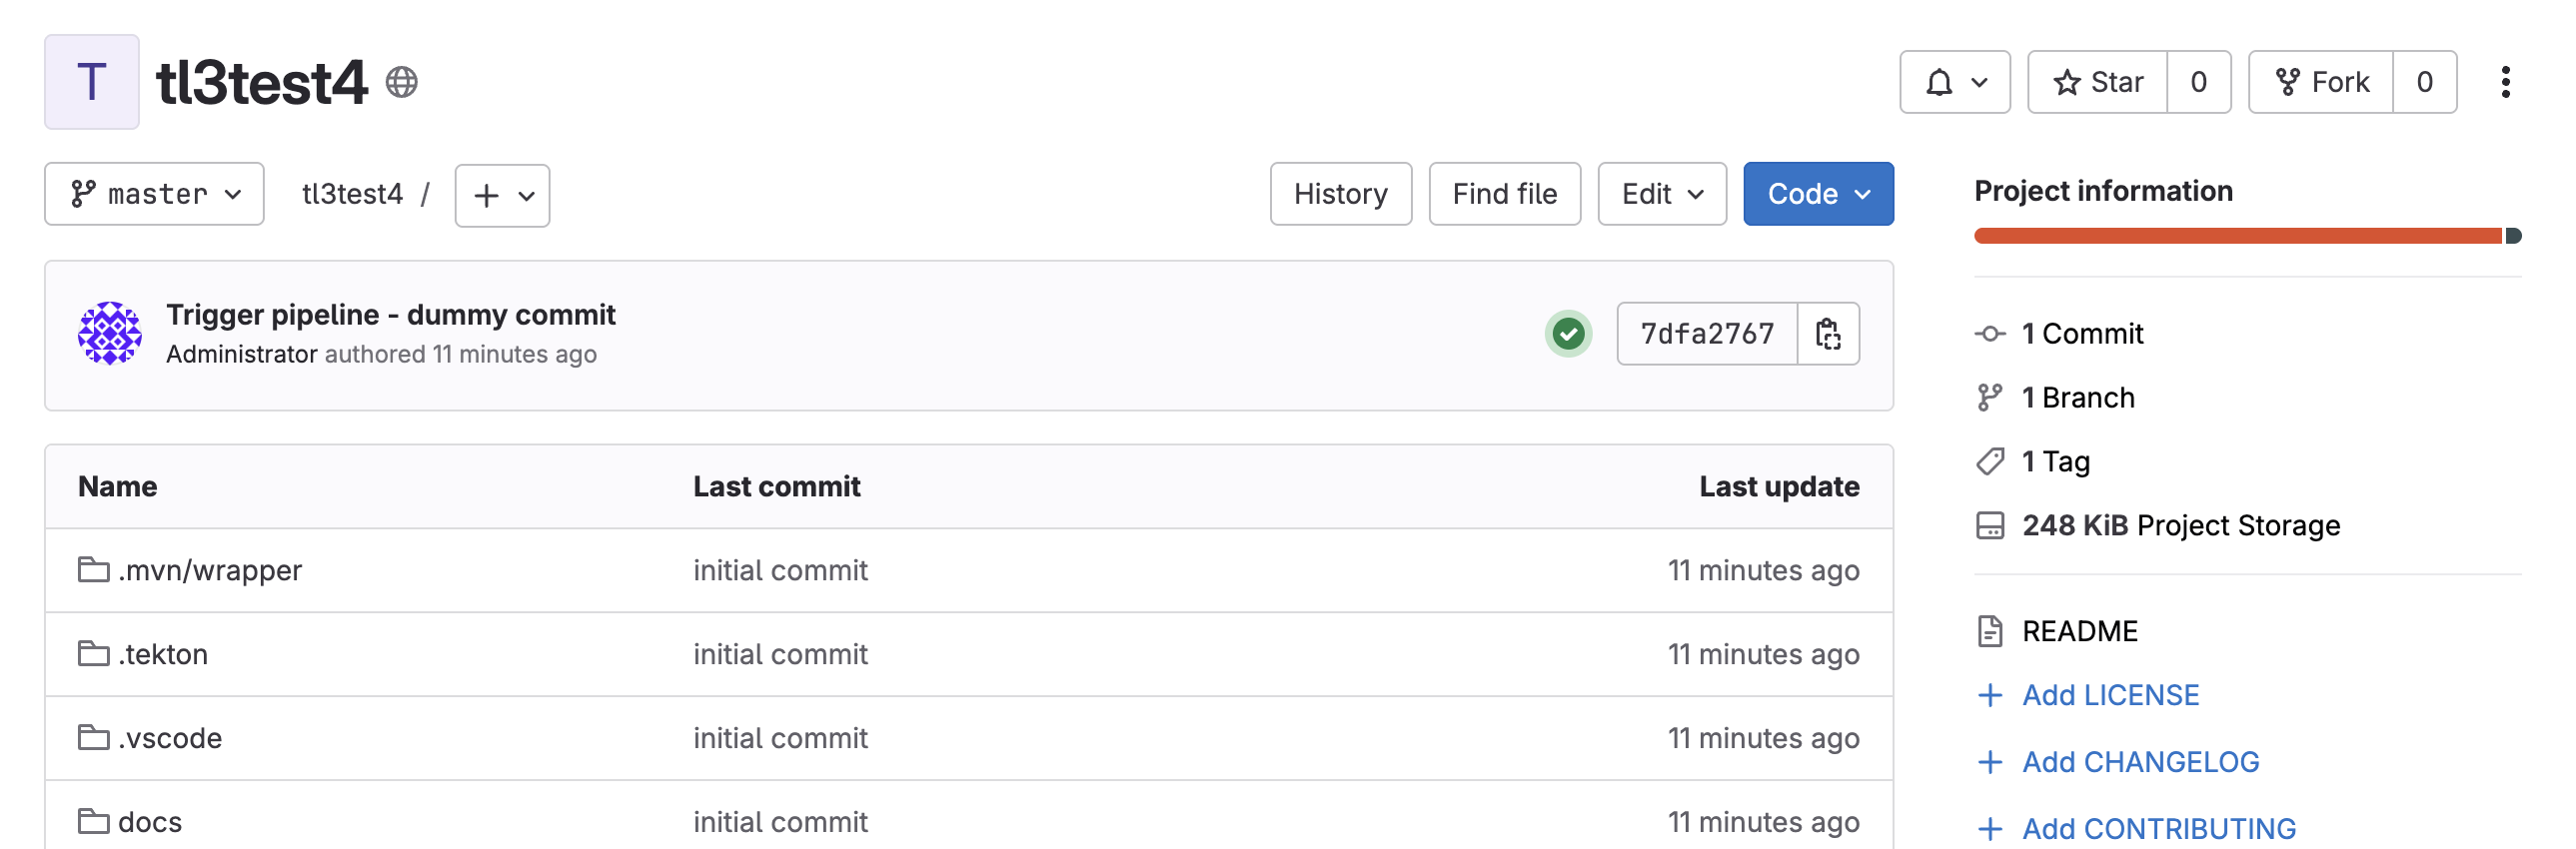
-
On the right hand side, under the Project Information, click on Tags (yours should have 0). When the tag page appears, click on New Tag, add some descriptive text, and then click on Create Tag. This will add a valid tag to the code repository. The scaffolded webhooks will then perform a pipeline run in the cluster to redeploy the staging application using the new tag as an identifier (typically you’d use release versions like
v1.0or some other meaningful identifier). -
Switch back to Red Hat Developer Hub, click on the Catalog, choose your component, and then click on CI. You will see another pipeline has executed to promote the current build to the staging project:
Now we will complete the development→staging→release cycle.
-
In Red Hat Developer Hub, again select your component through the catalog. Again, click on the
<> View Sourceicon to get to the GitLab repository (which was scaffolded by the template and has been tagged by yourself). -
Click on the Tag item again. Next to your created tag you will see a Create Release button; click on this now.
-
In the New Release dialog, give the release a title. Leave everything else as is, and click on the Create Release; in an actual environment this would be done post functional and non-functional testing of tagged staging application in the cluster.
-
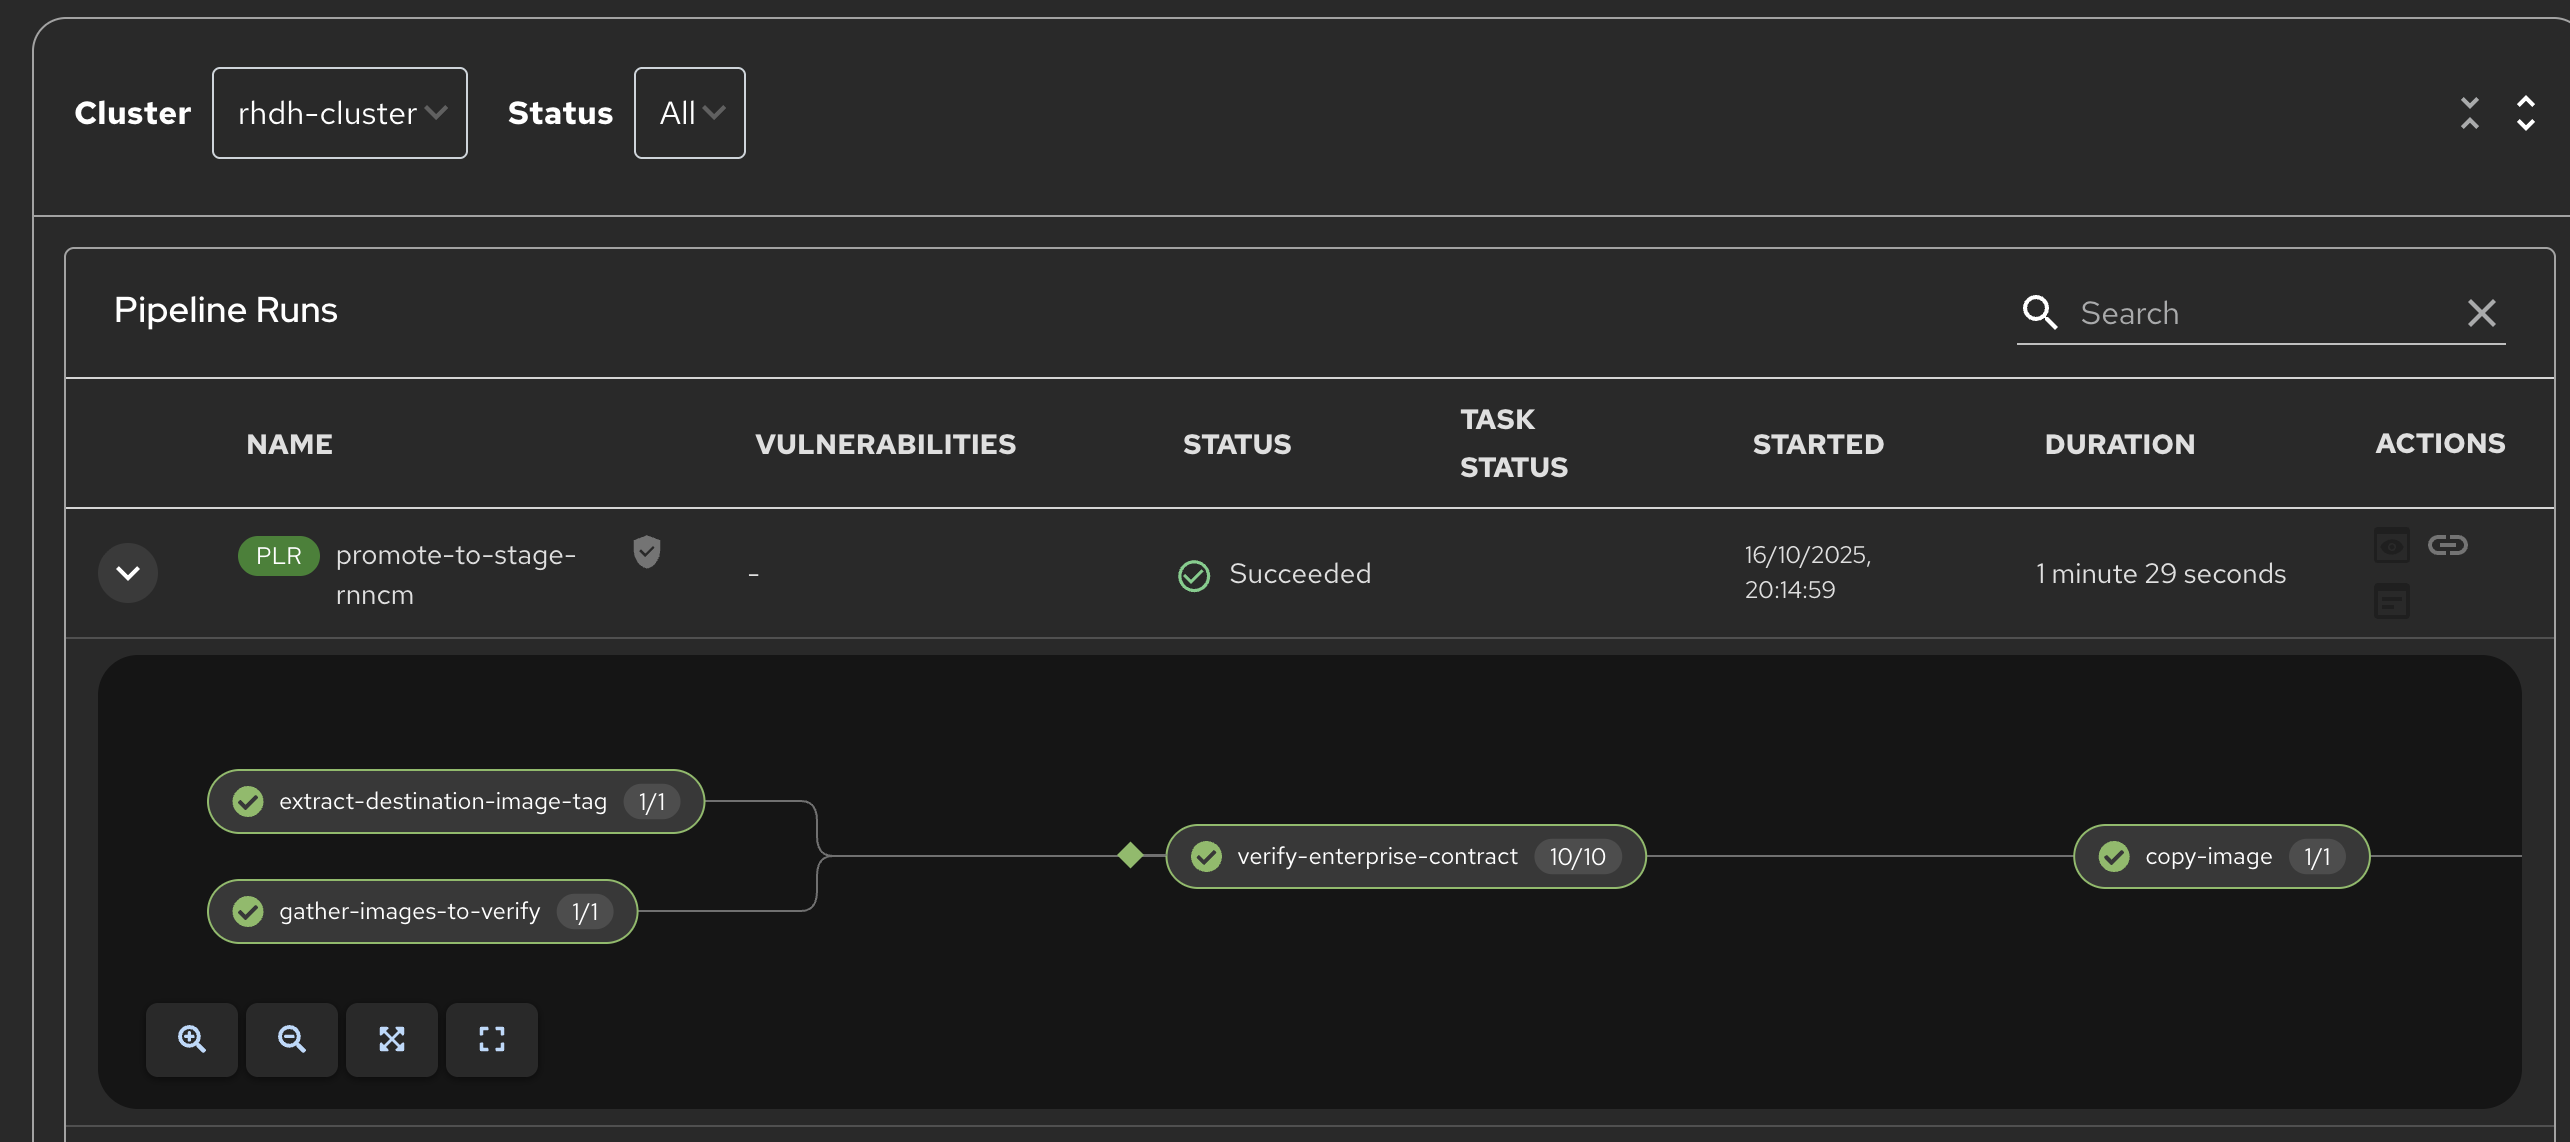
Switch back to Red Hat Developer Hub, select your component and click on CI. If you are quick enough you will see that another pipeline has been triggered by the creation of a release; the system is promoting the image from the staging application to the production one.
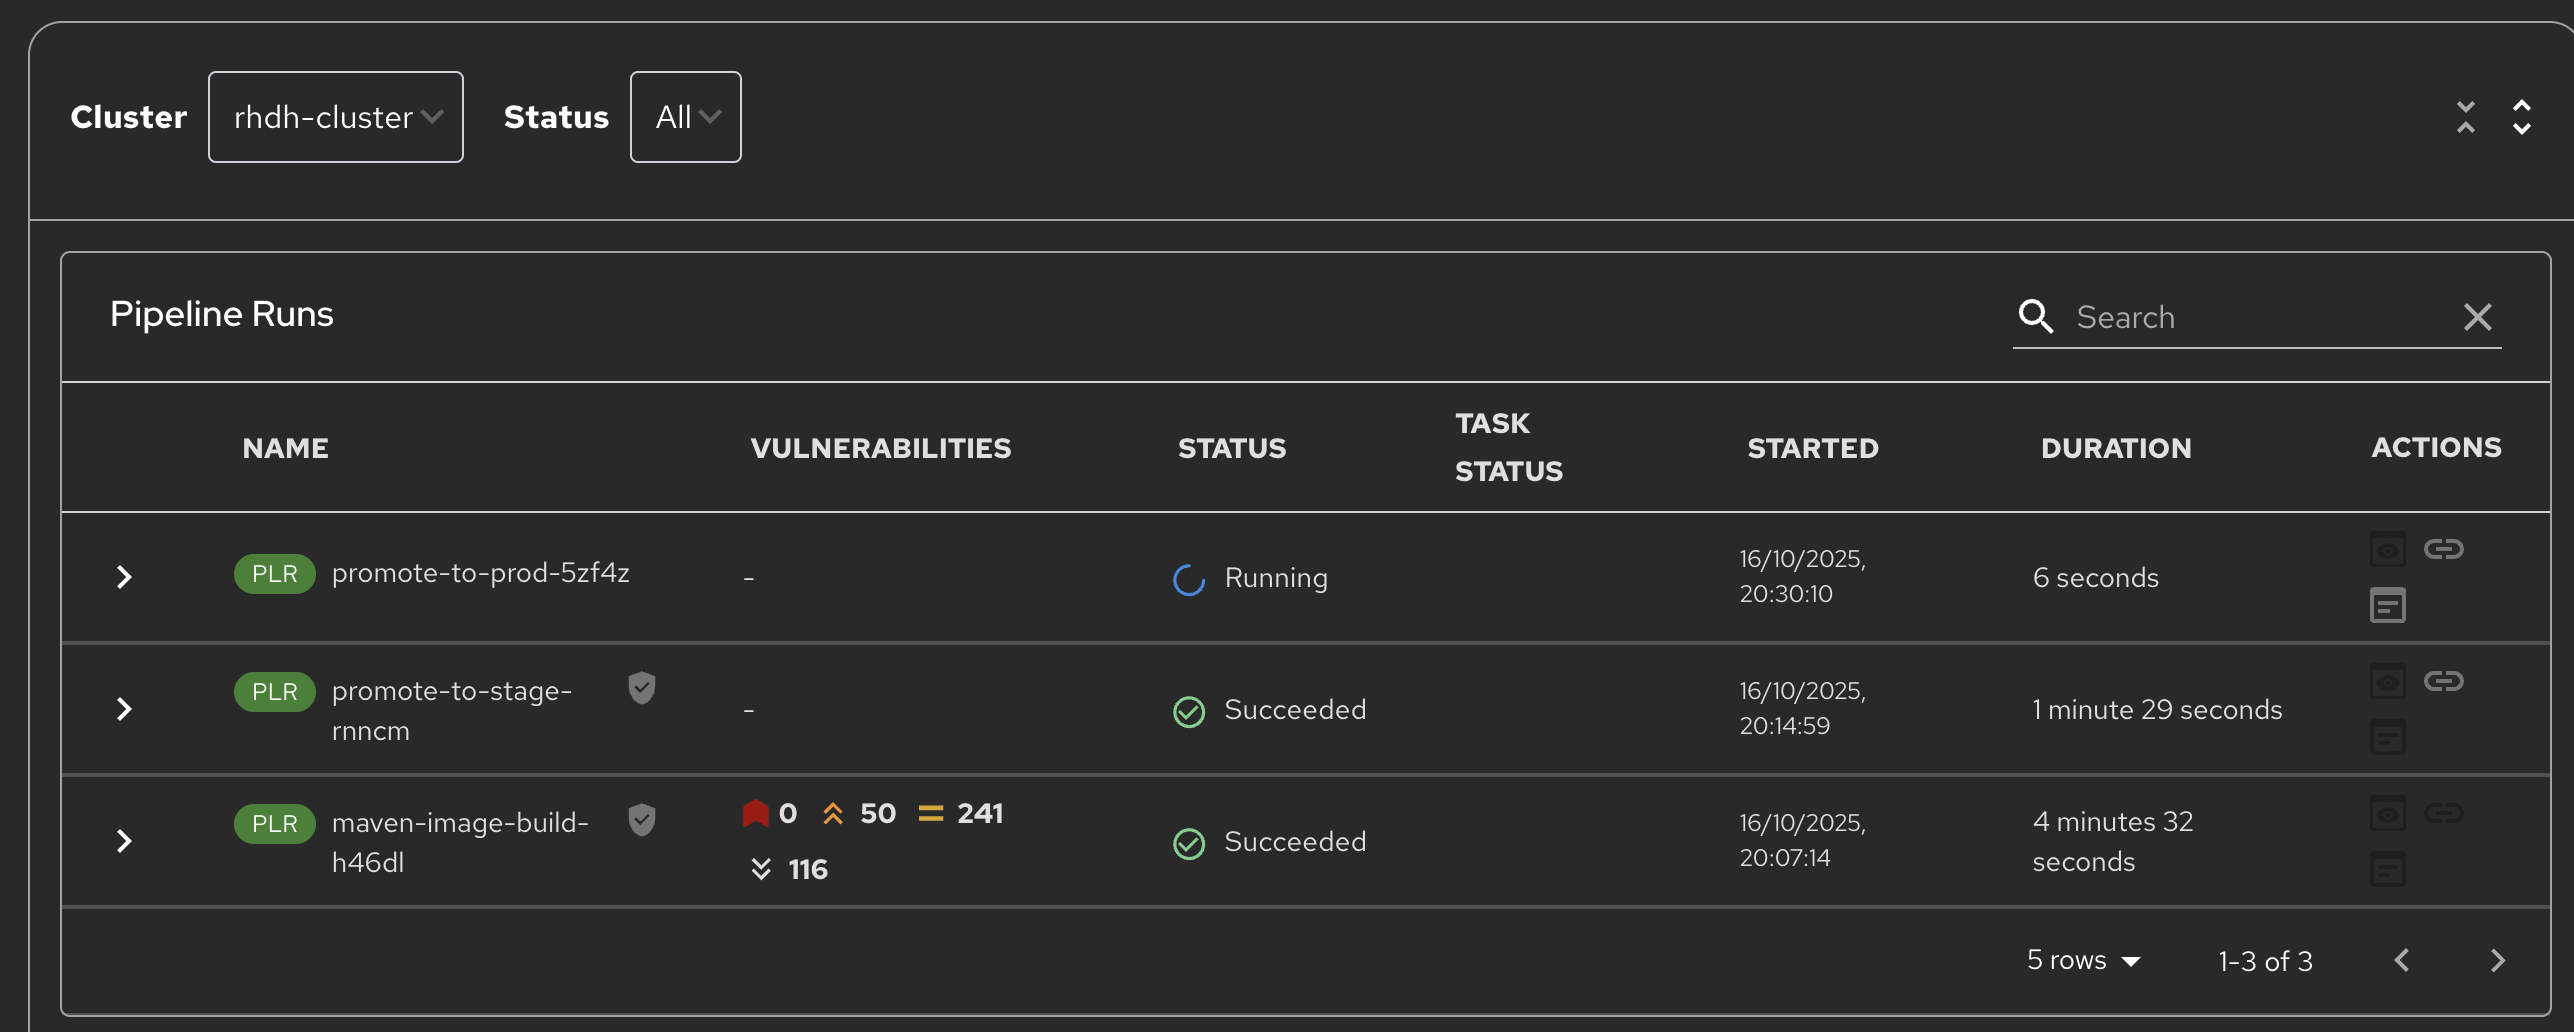
When this is completed, the application running in the production deployment will be based on the image that has been promoted from development, having been built there in a secure pipeline, to staging, and then promoted to production.
This is an opinionated but thorough and secure approach provided directly by the template instantiated through the Red Hat Developer Hub portal; we have automated and secured all the phases of development through to production.